Mid Sussex (UK Parliament constituency)
Coordinates: 51°01′59″N 0°06′54″W / 51.033°N 0.115°W
| Mid Sussex | |
|---|---|
|
County constituency for the House of Commons | |
|
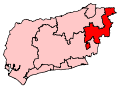
Boundary of Mid Sussex in West Sussex. | |
|
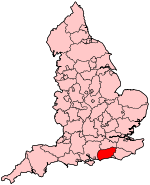
Location of West Sussex within England. | |
| County | West Sussex |
| Electorate | 77,044 (December 2010)[1] |
| Major settlements | East Grinstead, Haywards Heath and Burgess Hill |
| Current constituency | |
| Created | 1974 |
| Member of parliament | Nicholas Soames (Conservative) |
| Number of members | One |
| Created from | East Grinstead and Lewes |
| Overlaps | |
| European Parliament constituency | South East England |
Mid Sussex is a constituency[n 1] represented in the House of Commons of the UK Parliament since 1997 by Nicholas Soames, a Conservative.[n 2]
Constituency profile
The constituency is in the north east of West Sussex bordering East Sussex, containing relatively small villages and the towns of East Grinstead, Haywards Heath and Burgess Hill, all of which have green buffers preventing them from being contiguous and rail connections to Brighton, London Gatwick Airport and the City of London. The motorway network is also close by, the M23 providing access to this, west of the main towns.
Income levels are on average considerably higher than the national average[2] and levels of rented[3] and social housing[2] are below the national average, particularly levels seen in cities.
Boundaries
1974-1983: The Urban Districts of Burgess Hill and Cuckfield, and the Rural District of Cuckfield.
1983-1997: The District of Mid Sussex wards of Ardingly, Bolney, Burgess Hill Chanctonbury, Burgess Hill Franklands, Burgess Hill North, Burgess Hill St Andrews, Burgess Hill Town, Burgess Hill West, Clayton, Cuckfield, East Grinstead East, East Grinstead North, East Grinstead South, East Grinstead West, Haywards Heath Ashenground, Haywards Heath Bentswood, Haywards Heath Franklands, Haywards Heath Harlands, Haywards Heath Heath, Horsted Keynes, Hurstpierpoint, Keymer, Lindfield Rural, Lindfield Urban, and West Hoathly.
1997-2010: The District of Mid Sussex wards of Ardingly, Burgess Hill Chanctonbury, Burgess Hill Franklands, Burgess Hill North, Burgess Hill St Andrews, Burgess Hill Town, Burgess Hill West, Cuckfield, East Grinstead East, East Grinstead North, East Grinstead South, East Grinstead West, Haywards Heath Ashenground, Haywards Heath Bentswood, Haywards Heath Franklands, Haywards Heath Harlands, Haywards Heath Heath, Horsted Keynes, Lindfield Rural, Lindfield Urban, and West Hoathly.
2010-present: The District of Mid Sussex wards of Ashurst Wood, Bolney, Burgess Hill Dunstall, Burgess Hill Franklands, Burgess Hill Leylands, Burgess Hill Meeds, Burgess Hill St Andrews, Burgess Hill Victoria, Cuckfield, East Grinstead Ashplats, East Grinstead Baldwins, East Grinstead Herontye, East Grinstead Imberhorne, East Grinstead Town, Haywards Heath Ashenground, Haywards Heath Bentswood, Haywards Heath Franklands, Haywards Heath Heath, Haywards Heath Lucastes, High Weald, and Lindfield.
History
The constituency was created in 1974 from parts of the seats of Lewes and East Grinstead, and has undergone significant boundary changes at every periodical review that it has been around for. Prior to 1983, the local government district had actually been a part of East Sussex, but as a result of delayed implementation of the Local Government Act 1972, it was almost wholly moved into West Sussex.
At the 1983 general election, it gained some of the wards previously contained in East Grinstead, and at the 1997 election, it gained many of the semi-rural wards with smaller communities between East Grinstead and Crawley.
From its creation in 1983 to the present, it has been a safe Conservative seat, with the primary opposition until the 2015 election being the Liberal Democrats and their predecessors the Liberal party. In 2015, however, the severe fall in Lib Dem support saw Labour's candidate come second in the seat for the first time in its history, although much further behind the Conservatives than the Lib Dem candidates of elections past have tended to be.
Members of Parliament
| Election | Member[4] | Party | |
|---|---|---|---|
| Feb 1974 | Tim Renton | Conservative | |
| 1997 | Sir Nicholas Soames | Conservative | |
Elections
Elections in the 2010s
| Party | Candidate | Votes | % | ± | |
|---|---|---|---|---|---|
| Conservative | Nicholas Soames | 32,268 | 56.1 | +5.4 | |
| Labour | Greg Mountain | 7,982 | 13.9 | +7.3 | |
| UKIP | Toby Brothers | 6,898 | 12.0 | +9.5 | |
| Liberal Democrat | Daisy Cooper[7] | 6,604 | 11.5 | −26.0 | |
| Green | Miranda Diboll[8] | 2,453 | 4.3 | +3.1 | |
| Independent | Beki Adam[9] | 958 | 1.7 | N/A | |
| Monster Raving Loony | Baron Von Thunderclap | 329 | 0.6 | +0.1 | |
| Majority | 24,286 | 42.2 | |||
| Turnout | 57,492 | 72.3 | |||
| Conservative hold | Swing | +15.7 | |||
| Party | Candidate | Votes | % | ± | |
|---|---|---|---|---|---|
| Conservative | Nicholas Soames | 28,329 | 50.7 | +2.5 | |
| Liberal Democrat | Serena Tierney | 20,927 | 37.5 | +1.8 | |
| Labour | David Boot | 3,689 | 6.6 | −6.2 | |
| UKIP | Marc Montgomery | 1,423 | 2.5 | −0.7 | |
| Green | Paul Brown | 645 | 1.2 | +1.2 | |
| BNP | Stuart Minihane | 583 | 1.0 | +1.0 | |
| Monster Raving Loony | Baron von Thunderclap | 259 | 0.5 | +0.5 | |
| Majority | 7, 402 | 13.3 | |||
| Turnout | 55,855 | 72.4 | +3.5 | ||
| Conservative hold | Swing | +0.3 | |||
Elections in the 2000s
| Party | Candidate | Votes | % | ± | |
|---|---|---|---|---|---|
| Conservative | Nicholas Soames | 23,765 | 48.0 | +1.8 | |
| Liberal Democrat | Serena Tierney | 17,875 | 36.1 | +5.0 | |
| Labour | Robert Fromant | 6,280 | 12.7 | −6.3 | |
| UKIP | Harold Piggott | 1,574 | 3.2 | +0.7 | |
| Majority | 5,890 | 11.9 | |||
| Turnout | 49,494 | 68.6 | 3.7 | ||
| Conservative hold | Swing | −1.6 | |||
| Party | Candidate | Votes | % | ± | |
|---|---|---|---|---|---|
| Conservative | Nicholas Soames | 21,150 | 46.2 | +2.7 | |
| Liberal Democrat | Lesley Wilkins | 14,252 | 31.1 | +0.5 | |
| Labour | Paul Mitchell | 8,693 | 19.0 | +0.3 | |
| UKIP | Petrina Holdsworth | 1,126 | 2.5 | +1.3 | |
| Monster Raving Loony | Baron Von Thunderclap Berry | 601 | 1.3 | N/A | |
| Majority | 6,898 | 15.1 | |||
| Turnout | 45,822 | 64.9 | −12.7 | ||
| Conservative hold | Swing | ||||
Elections in the 1990s
| Party | Candidate | Votes | % | ± | |
|---|---|---|---|---|---|
| Conservative | Nicholas Soames | 23,231 | 43.5 | −15.5 | |
| Liberal Democrat | Margaret Collins | 16,377 | 30.6 | +2.4 | |
| Labour | Mervyn Hamilton | 9,969 | 18.6 | +8.0 | |
| Referendum | Tam Large | 3,146 | 5.9 | N/A | |
| UKIP | J.V. Barnett | 606 | 1.1 | N/A | |
| Justice and Renewal Independent Party | Ernest Tudway | 134 | 0.3 | N/A | |
| Majority | 6,854 | 12.8 | |||
| Turnout | 53,463 | 77.6 | |||
| Conservative hold | Swing | ||||
This constituency underwent boundary changes between the 1992 and 1997 general elections and thus change in share of vote is based on a notional calculation.
| Party | Candidate | Votes | % | ± | |
|---|---|---|---|---|---|
| Conservative | Timothy Renton | 39,524 | 59.0 | −2.1 | |
| Liberal Democrat | Margaret Collins | 18,996 | 28.4 | −3.1 | |
| Labour | L C Gregory | 6,951 | 10.4 | +3.0 | |
| Green | H G Stevens | 772 | 1.1 | N/A | |
| Monster Raving Loony | P B Berry | 392 | 0.6 | N/A | |
| Independent | P D Hodkin | 246 | 0.4 | N/A | |
| Natural Law | Dr A M A Hankey | 89 | 0.1 | N/A | |
| Majority | 20,528 | 30.6 | +1.0 | ||
| Turnout | 66,970 | 82.9 | |||
| Conservative hold | Swing | +5.7 | |||
Elections in the 1980s
| Party | Candidate | Votes | % | ± | |
|---|---|---|---|---|---|
| Conservative | Timothy Renton | 37,781 | 61.1 | −0.3 | |
| Liberal | Nicholas Shawn Edney Westbrook | 19,489 | 31.5 | −0.8 | |
| Labour | Robert Stephen Edwin Hughes | 4,573 | 7.4 | +1.4 | |
| Majority | 18,292 | 29.6 | |||
| Turnout | 61,843 | 77.2 | +2.5 | ||
| Conservative hold | Swing | ||||
| Party | Candidate | Votes | % | ± | |
|---|---|---|---|---|---|
| Conservative | Timothy Renton | 35,310 | 61.4 | ||
| Liberal | J M Campbell | 18,566 | 32.3 | ||
| Labour | P A Hawkes | 3,470 | 6.0 | ||
| Independent | J Bray | 196 | 0.3 | ||
| Majority | 16,744 | 29.1 | |||
| Turnout | 57,542 | 74.7 | |||
| Conservative hold | Swing | ||||
This constituency underwent boundary changes between the 1979 and 1983 general elections and thus calculation of the change in share of vote is not possible.
Elections in the 1970s
| Party | Candidate | Votes | % | ± | |
|---|---|---|---|---|---|
| Conservative | Timothy Renton | 32,548 | 61.2 | ||
| Liberal | J M Campbell | 11,705 | 22.0 | ||
| Labour | Des Turner | 8,260 | 15.5 | ||
| Independent Conservative | S M H Haslett | 697 | 1.3 | ||
| Majority | 20,843 | 39.2 | |||
| Turnout | 53,210 | 78.0 | |||
| Conservative hold | Swing | ||||
| Party | Candidate | Votes | % | ± | |
|---|---|---|---|---|---|
| Conservative | Timothy Renton | 25,126 | 53.9 | ||
| Liberal | Robert Alexander Symes-Schutzman | 13,129 | 28.1 | ||
| Labour | M R Fraser | 8,404 | 18.0 | ||
| Majority | 11,997 | 25.7 | |||
| Turnout | 46,659 | 76.4 | |||
| Conservative hold | Swing | ||||
| Party | Candidate | Votes | % | ± | |
|---|---|---|---|---|---|
| Conservative | Timothy Renton | 27,317 | 54.1 | ||
| Liberal | Bob Symes | 15,162 | 30.0 | ||
| Labour | M R Fraser | 7,993 | 15.8 | ||
| Majority | 12,155 | 24.1 | |||
| Turnout | 50,472 | 83.3 | |||
| Conservative hold | Swing | ||||
See also
Notes and references
- Notes
- ↑ A county constituency (for the purposes of election expenses and type of returning officer)
- ↑ As with all constituencies, the constituency elects one Member of Parliament (MP) by the first past the post system of election at least every five years.
- References
- ↑ "Electorate Figures - Boundary Commission for England". 2011 Electorate Figures. Boundary Commission for England. 4 March 2011. Retrieved 13 March 2011.
- 1 2 2001 Census
- ↑ 2011 census interactive maps
- ↑ Leigh Rayment's Historical List of MPs – Constituencies beginning with "S" (part 6)
- ↑ "Election Data 2015". Electoral Calculus. Archived from the original on 17 October 2015. Retrieved 17 October 2015.
- ↑ http://www.bbc.com/news/politics/constituencies/E14000817
- ↑ "Daisy Cooper PPC page". Liberal Democrats. Retrieved 21 February 2015.
- ↑ http://midsussex.greenparty.org.uk/2013-08-08/local-party-elects-prospective-parliamentary-candidates-for-horsham-and-mid-sussex.html
- ↑ "Mid Sussex". YourNextMP. Retrieved 21 February 2015.
- ↑ "Election Data 2010". Electoral Calculus. Archived from the original on 26 July 2013. Retrieved 17 October 2015.
- ↑ "'Sussex Mid', May 1997 -". ElectionWeb Project. Cognitive Computing Limited. Retrieved 18 May 2016.
- ↑ "Politics Resources". Election 1992. Politics Resources. 9 April 1992. Retrieved 6 Dec 2010.
Sources
- Election result, 2015 (BBC)
- Election result, 2010 (BBC)
- Election result, 2005 (BBC)
- Election results, 1997 - 2001 (BBC)
- Election results, 1997 - 2001 (Election Demon)
- Election results, 1983 - 1997 (Election Demon)
- Election results, 1974 - 2001 (Political Science Resources)