Woking (UK Parliament constituency)
| Woking | |
|---|---|
|
Borough constituency for the House of Commons | |
|
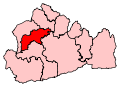
Boundary of Woking in Surrey. | |
|
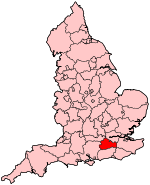
Location of Surrey within England. | |
| County | Surrey |
| Electorate | 74,328 (December 2010) |
| Current constituency | |
| Created | 1950 |
| Member of parliament | Jonathan Lord (Conservative) |
| Overlaps | |
| European Parliament constituency | South East England |
Woking is a constituency represented in the House of Commons of the Parliament of the United Kingdom. It elects one Member of Parliament (MP) by the first past the post system of election. It was created in 1950 from the county constituency of Chertsey. Woking has historically been a Conservative safe seat, with the Liberal Democrats being the principal opposition in the last five general elections, up until 2015 when Labour overtook them. Its current Member of Parliament is Jonathan Lord.
Boundaries
1950-1974: The Urban Districts of Frimley and Camberley, and Woking, and in the Rural District of Guildford the civil parishes of Ash and Normandy, and Pirbright.
1974-1983: The Urban District of Woking, and in the Rural District of Guildford the civil parishes of Ash, Normandy, and Pirbright.
1983-1997: The Borough of Woking, and the Borough of Guildford wards of Ash, Ash Vale, Normandy, and Pirbright.
1997-present: The Borough of Woking, and the Borough of Guildford wards of Normandy and Pirbright.
The constituency is based around the town of Woking in Surrey and includes the entirety of the Woking borough and two wards from the Guildford borough. The Boundary Commission made no boundary changes for Woking in the review before the 2010 general election.
Members of Parliament
| Election | Member[1] | Party | |
|---|---|---|---|
| 1950 | Harold Watkinson | Conservative | |
| 1964 | Sir Cranley Onslow | Conservative | |
| 1997 | Humfrey Malins | Conservative | |
| 2010 | Jonathan Lord | Conservative | |
Elections
Elections in the 2010s
| Party | Candidate | Votes | % | ± | |
|---|---|---|---|---|---|
| Conservative | Jonathan Lord | 29,199 | 56.2 | +5.9 | |
| Labour | Jill Rawling | 8,389 | 16.1 | +8.1 | |
| Liberal Democrat | Chris Took | 6,047 | 11.6 | −25.8 | |
| UKIP | Rob Burberry | 5,873 | 11.3 | +7.5 | |
| Green | Martin Robson | 2,109 | 4.1 | N/A | |
| CISTA | Declan Wade | 229 | 0.4 | N/A | |
| Magna Carta Conservation Party Great Britain | Ruth Temple | 77 | 0.1 | N/A | |
| The Evolution Party | Angela Woolford | 41 | 0.1 | N/A | |
| Majority | 20,810 | 40.0 | +27.1 | ||
| Turnout | 51,964 | 70.0 | −1.5 | ||
| Conservative hold | Swing | ||||
On 9 June 2015, it was announced that the 2015 election result had been challenged by the Magna Carta Conservation Party candidate, Ruth Temple. Temple claimed in her petition that Jonathan Lord had been ineligible to stand and was thus not duly elected.[4][5]
| Party | Candidate | Votes | % | ± | |
|---|---|---|---|---|---|
| Conservative | Jonathan Lord | 26,551 | 50.3 | +2.9 | |
| Liberal Democrat | Rosie Sharpley | 19,744 | 37.4 | +4.3 | |
| Labour | Tom Miller | 4,246 | 8.0 | -8.3 | |
| UKIP | Rob Burberry | 1,997 | 3.8 | +0.9 | |
| Peace | Julie Roxburgh | 204 | 0.4 | N/A | |
| Magna Carta Conservation Party Great Britain | Ruth Temple | 44 | 0.1 | N/A | |
| Majority | 6,807 | 12.9 | -1.5 | ||
| Turnout | 52,786 | 71.5 | +8.1 | ||
| Conservative hold | Swing | −0.7 | |||
Elections in the 2000s
| Party | Candidate | Votes | % | ± | |
|---|---|---|---|---|---|
| Conservative | Humfrey Malins | 21,838 | 47.4 | +1.4 | |
| Liberal Democrat | Anne Lee | 15,226 | 33.1 | +2.8 | |
| Labour | Ellie Blagbrough | 7,507 | 16.3 | −4.0 | |
| UKIP | Matthew Davies | 1,324 | 2.9 | -0.5 | |
| UK Community Issues Party | Michael Osman | 150 | 0.3 | N/A | |
| Majority | 6,612 | 14.4 | |||
| Turnout | 46,045 | 63.4 | +3.2 | ||
| Conservative hold | Swing | −0.7 | |||
| Party | Candidate | Votes | % | ± | |
|---|---|---|---|---|---|
| Conservative | Humfrey Malins | 19,747 | 46.0 | +7.6 | |
| Liberal Democrat | Alan Hilliar | 12,988 | 30.3 | +3.0 | |
| Labour | Sabir Hussain | 8,714 | 20.3 | -0.7 | |
| UKIP | Michael Harvey | 1,461 | 3.4 | +2.4 | |
| Majority | 6,759 | 15.7 | |||
| Turnout | 42,910 | 60.2 | -12.5 | ||
| Conservative hold | Swing | ||||
Elections in the 1990s
| Party | Candidate | Votes | % | ± | |
|---|---|---|---|---|---|
| Conservative | Humfrey Malins | 19,553 | 38.4 | -20.7 | |
| Liberal Democrat | Philip Goldenberg | 13,875 | 27.3 | +0.2 | |
| Labour | Katie Hanson | 10,695 | 21.0 | +7.6 | |
| Independent Conservative | Hugh Bell | 3,933 | 7.7 | N/A | |
| Referendum | Christopher Skeate | 2,209 | 4.3 | N/A | |
| UKIP | Michael Harvey | 512 | 1.0 | N/A | |
| Natural Law | Deirdre Sleeman | 137 | 0.3 | ||
| Majority | 5,678 | 11.2 | |||
| Turnout | 50,914 | 72.7 | |||
| Conservative hold | Swing | ||||
This constituency underwent boundary changes between the 1992 and 1997 general elections and thus change in share of vote is based on a notional calculation.
| Party | Candidate | Votes | % | ± | |
|---|---|---|---|---|---|
| Conservative | Cranley Onslow | 37,744 | 58.9 | +0.9 | |
| Liberal Democrat | Mrs Dorothy A. Buckrell | 17,902 | 28.0 | −3.4 | |
| Labour | James M. Dalgleish | 8,080 | 12.6 | +2.1 | |
| Natural Law | Mrs Teresa A. Macintyre | 302 | 0.5 | N/A | |
| Majority | 19,842 | 31.0 | +4.3 | ||
| Turnout | 64,028 | 79.2 | +4.1 | ||
| Conservative hold | Swing | +2.1 | |||
Elections in the 1980s
| Party | Candidate | Votes | % | ± | |
|---|---|---|---|---|---|
| Conservative | Cranley Onslow | 35,990 | 58.1 | ||
| SDP–Liberal Alliance (Liberal) | Philip Goldenberg | 19,446 | 31.4 | ||
| Labour | Anita Pollack | 6,537 | 10.5 | ||
| Majority | 16,544 | 26.7 | |||
| Turnout | 61,973 | 75.1 | |||
| Conservative hold | Swing | ||||
| Party | Candidate | Votes | % | ± | |
|---|---|---|---|---|---|
| Conservative | Cranley Onslow | 32,748 | 58.3 | ||
| SDP–Liberal Alliance (Liberal) | Philip Goldenberg | 16,511 | 29.4 | ||
| Labour | Barbara Broer | 6,566 | 11.7 | ||
| Party of Associates with Licensees | D. M. Comens | 368 | 0.6 | ||
| Majority | 16,237 | 28.9 | |||
| Turnout | 56,193 | 71.7 | |||
| Conservative hold | Swing | ||||
Elections in the 1970s
| Party | Candidate | Votes | % | ± | |
|---|---|---|---|---|---|
| Conservative | Cranley Onslow | 31,719 | 57.05 | ||
| Labour | Nigel Beard | 13,327 | 23.97 | ||
| Liberal | George H. Dunk | 9,991 | 17.97 | ||
| National Front | P. A. Gleave | 564 | 1.01 | ||
| Majority | 18,392 | 33.08 | |||
| Turnout | 55,601 | 76.51 | |||
| Conservative hold | Swing | ||||
| Party | Candidate | Votes | % | ± | |
|---|---|---|---|---|---|
| Conservative | Cranley Onslow | 22,804 | 46.04 | ||
| Liberal | P. Wade | 14,069 | 28.40 | ||
| Labour | J. W. Tattersall | 11,737 | 23.70 | ||
| National Front | R. Vaughan-Smith | 921 | 1.86 | ||
| Majority | 8,735 | 17.64 | |||
| Turnout | 49,531 | 72.93 | |||
| Conservative hold | Swing | ||||
| Party | Candidate | Votes | % | ± | |
|---|---|---|---|---|---|
| Conservative | Cranley Onslow | 25,243 | 46.33 | ||
| Liberal | P. Wade | 17,660 | 32.41 | ||
| Labour | J. W. Tattersall | 11,583 | 21.26 | ||
| Majority | 7,583 | 13.92 | |||
| Turnout | 54,486 | 80.87 | |||
| Conservative hold | Swing | ||||
| Party | Candidate | Votes | % | ± | |
|---|---|---|---|---|---|
| Conservative | Cranley Onslow | 37,220 | 56.71 | ||
| Labour | R. M. Taylor | 18,652 | 28.42 | ||
| Liberal | P. Wade | 9,763 | 14.87 | ||
| Majority | 18,568 | 28.29 | |||
| Turnout | 65,635 | 69.88 | |||
| Conservative hold | Swing | ||||
Elections in the 1960s
| Party | Candidate | Votes | % | ± | |
|---|---|---|---|---|---|
| Conservative | Cranley Onslow | 32,057 | 51.40 | ||
| Labour | Michael Downing | 19,210 | 30.80 | ||
| Liberal | Mrs. Agnes H. Scott | 11,104 | 17.80 | ||
| Majority | 12,847 | 20.60 | |||
| Turnout | 62,371 | 77.11 | |||
| Conservative hold | Swing | ||||
| Party | Candidate | Votes | % | ± | |
|---|---|---|---|---|---|
| Conservative | Cranley Onslow | 31,170 | 51.70 | ||
| Labour | H. G. N. Clother | 17,834 | 29.58 | ||
| Liberal | Mrs. Agnes H. Scott | 11,285 | 18.72 | ||
| Majority | 13,336 | 22.12 | |||
| Turnout | 60,289 | 78.09 | |||
| Conservative hold | Swing | ||||
Elections in the 1950s
| Party | Candidate | Votes | % | ± | |
|---|---|---|---|---|---|
| Conservative | Harold Watkinson | 33,521 | 67.40 | ||
| Labour | R. D. V. Williams | 16,210 | 32.60 | ||
| Majority | 17,311 | 34.81 | |||
| Turnout | 49,731 | 77.35 | |||
| Conservative hold | Swing | ||||
| Party | Candidate | Votes | % | ± | |
|---|---|---|---|---|---|
| Conservative | Harold Watkinson | 27,860 | 64.41 | ||
| Labour | R. D. V. Williams | 15,393 | 35.59 | ||
| Majority | 12,467 | 28.82 | |||
| Turnout | 43,253 | 75.72 | |||
| Conservative hold | Swing | ||||
| Party | Candidate | Votes | % | ± | |
|---|---|---|---|---|---|
| Conservative | Harold Watkinson | 26,522 | 64.95 | ||
| Labour | W. Eric Wolff | 14,313 | 35.05 | ||
| Majority | 12,209 | 29.90 | |||
| Turnout | 40,835 | 78.73 | |||
| Conservative hold | Swing | ||||
| Party | Candidate | Votes | % | ± | |
|---|---|---|---|---|---|
| Conservative | Harold Watkinson | 24,454 | 57.98 | ||
| Labour | T. Davies | 13,157 | 31.19 | ||
| Liberal | Michael Fernley Turner-Bridger | 4,567 | 10.83 | ||
| Majority | 11,297 | 26.78 | |||
| Turnout | 42,178 | 83.24 | |||
| Conservative hold | Swing | ||||
See also
Notes and references
- ↑ Leigh Rayment's Historical List of MPs – Constituencies beginning with "W" (part 5)
- ↑ "Election Data 2015". Electoral Calculus. Archived from the original on 17 October 2015. Retrieved 17 October 2015.
- ↑
- ↑ "Election Petition Public Notice" (PDF). Woking Borough Council. Woking Borough Council. Retrieved 24 July 2015.
- ↑ Pack, Mark. "Three election petitions against constituency results". Retrieved 24 July 2015.
- ↑ "Election Data 2010". Electoral Calculus. Archived from the original on 17 October 2015. Retrieved 17 October 2015.
- ↑ "Election Data 2005". Electoral Calculus. Archived from the original on 15 October 2011. Retrieved 18 October 2015.
- ↑ "Election Data 2001". Electoral Calculus. Archived from the original on 15 October 2011. Retrieved 18 October 2015.
- ↑ "Election Data 1997". Electoral Calculus. Archived from the original on 15 October 2011. Retrieved 18 October 2015.
- ↑ "Election Data 1992". Electoral Calculus. Archived from the original on 15 October 2011. Retrieved 18 October 2015.
- ↑ "Politics Resources". Election 1992. Politics Resources. 9 April 1992. Retrieved 2010-12-06.
- ↑ "Election Data 1987". Electoral Calculus. Archived from the original on 15 October 2011. Retrieved 18 October 2015.
- ↑ "Election Data 1983". Electoral Calculus. Archived from the original on 15 October 2011. Retrieved 18 October 2015.
Sources
- Election result, 2015 (BBC)
- Election result, 2010 (BBC)
- Election result, 2005 (BBC)
- Election results, 1997 - 2001 (BBC)
- Election results, 1997 - 2001 (Election Demon)
- Election results, 1983 - 1992 (Election Demon)
- Election results, 1950 - 1979 (Politics Resources)
Coordinates: 51°18′N 0°36′W / 51.3°N 0.6°W