Non-contact atomic force microscopy

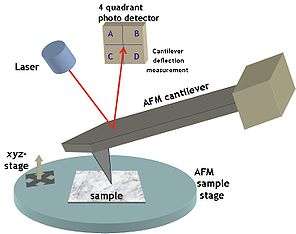
Non-contact atomic force microscopy (nc-AFM), also known as dynamic force microscopy (DFM), is a mode of atomic force microscopy, which itself is a type of scanning probe microscopy. In nc-AFM a sharp probe is moved close (order of Angstroms) to the surface under study, the probe is then raster scanned across the surface, the image is then constructed from the force interactions during the scan. The probe is connected to a resonator, usually a silicon cantilever or a quartz crystal resonator. During measurements the sensor is driven so that it oscillates. The force interactions are measured either by measuring the change in amplitude of the oscillation at a constant frequency just off resonance (amplitude modulation) or by measuring the change in resonant frequency directly using a feedback circuit (usually a phase-locked loop) to always drive the sensor on resonance (frequency modulation).
Modes of operation
The two most common modes of nc-AFM operation, frequency modulation and amplitude modulation, are described below.
Frequency modulation
Frequency modulation atomic force microscopy, introduced by Albrecht, Grütter, Horne and Rugar in 1991,[2] is a mode of nc-AFM where the change in resonant frequency of the sensor is tracked directly, by always exciting the sensor on resonance. To maintain excitation on resonance the electronics must keep a 90° phase difference between the excitation and response of the sensor. This is either done by driving the sensor with the deflection signal phase shifted by 90°, or by using an advanced phase-locked loop which can lock to a specific phase.[3] The microscope can then use the change in resonant frequency (f) as the SPM reference channel, either in feedback mode, or it can be recorded directly in constant height mode.

While recording frequency-modulated images, an additional feedback loop is normally used to keep the amplitude of resonance constant, by adjusting the drive amplitude. By recording the drive amplitude during the scan (usually referred to as the damping channel as the need for a higher drive amplitude corresponds to more damping in the system) a complementary image is recorded showing only non-conservative forces. This allows conservative and non-conservative forces in the experiment to be separated.
Amplitude modulation
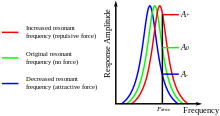
Amplitude modulation was one of the original modes of operation introduced by Binnig and Quate in their seminal 1986 AFM paper,[4] in this mode the sensor is excited just off resonance. By exciting the sensor just above its resonant frequency, it is possible to detect forces which change the resonant frequency by monitoring the amplitude of oscillation. An attractive force on the probe causes a decrease in the sensors resonant frequency, thus the driving frequency is further from resonance and the amplitude decreases, the opposite is true for a repulsive force. The microscopes control electronics can then use amplitude as the SPM reference channel, either in feedback mode, or it can be recorded directly in constant height mode.
Amplitude modulation can fail if the non-conservative forces (damping) change during the experiment, as this changes the amplitude of the resonance peak itself, which will be interpreted as a change in resonant frequency. Another potential problem with amplitude modulation is that a sudden change to a more repulsive (less attractive) force can shift the resonance past the drive frequency causing it to decrease again. In constant height mode this will just lead to an image artefact, but in feedback mode the feedback will read this as a stronger attractive force, causing positive feedback until the feedback saturates.
An advantage of amplitude modulation is that there is only one feedback loop (the topography feedback loop) compared to three in frequency modulation (the phase/frequency loop, the amplitude loop, and the topography loop), making both operation and implementation much easier. Amplitude modulation, however, is rarely used in vacuum as the Q of the sensor is usually so high that the sensor oscillates many times before the amplitude settles to its new value, thus slowing down operation.
Sensors
Silicon microcantilever
Silicon microcantilevers are used for both contact AFM and nc-AFM. Silicon microcantilevers are produced from etching small (~100×10×1 μm) rectangular, triangular, or V-shaped cantilevers from silicon nitride. Originally they were produced without integrated tips and metal tips had to be evaporated on,[5] later a method was found to integrate the tips into the cantilever fabrication process.[6]
nc-AFM cantilevers tend to have a higher stiffness, ~40 N/m, and resonant frequency, ~200 kHz, than contact AFM cantilevers (with stiffnesses ~0.2 N/m and resonant frequencies ~15 kHz). The reason for the higher stiffness is stop the probe snapping to contact with the surface due to Van der Waals forces.[7]
Silicon microcantilever tips can be coated for specific purposes, such as a ferromagnetic coatings for use as a magnetic force microscope. By doping the silicon, the sensor can be made conductive to allow simultaneous scanning tunneling microscopy (STM) and nc-AFM operation.[8]
qPlus sensor
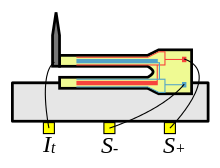
A qPlus sensor is used in many ultra-high vacuum nc-AFMs. The sensor was originally made from a quartz tuning fork from a wristwatch. In contrast to a quartz tuning fork sensor that consists of two coupled tines that oscillate opposed to each other, a qPlus sensor has only one tine that oscillates. The tuning fork is glued to a mount such that one tine of the tuning fork is immobilised, a tungsten wire, etched to have a sharp apex, is then glued to the free prong.[9] The sensor was invented in 1996[10] by physicist Franz J. Giessibl. The AFM deflection signal is generated by the piezoelectric effect, and can be read from the two electrodes on the tuning fork.
As the tungsten tip wire is conductive, the sensor can be used for combined STM/nc-AFM operation. The tip can either be electrically connected to one of tuning fork electrodes, or to a separate thin (~30μm diameter) gold wire.[11] The advantage of the separate wire is that it can reduce cross-talk between the tunnel current and the deflection channels, however the wire will have its own resonance, which can affect the resonant properties of the sensor. New versions of the qPlus sensor with one or several integrated service electrodes as proposed in reference [12] solve that problem. The Bergman reaction has recently been imaged by the IBM group in Zurich using such a qPlus sensor with integrated STM electroce.[13]
The sensor has a much higher stiffness than silicon microcantilevers, ~1800 N/m[14] (tip placement further down the tine can lead to higher stiffness’s ~2600 N/m[15]). This higher stiffness allows higher forces before snap to contact instabilities. The resonant frequency of a qPlus sensor is typically lower than that of a silicon microcantilever, ~25 kHz (Watch tuning forks have a resonant frequency of 32,768 kHz before tip placement). Several factors (in particular detector noise and eigenfrequency) affect the speed of operation.[16] qPlus sensors with long tip wires that approach the length of the sensor display a movement of the apex which is no longer perpendicular to the surface, thus probing the forces in a different direction to expected.[17]
Other sensors
Before the development of the silicon microcantilever, gold foil[4] or tungsten wires[18] were used as AFM sensors. A range of designs of quartz crystal resonators have been used,[19][20] the most famous is the above-mentioned qPlus sensor. A new development which is getting attention is the KolibriSensor,[21] using a length extensional quartz resonator, with a very high resonant frequency (~1 MHz) allowing very fast operation.
Force measurements
Force spectroscopy
Force spectroscopy is a method to measure forces between the tip and the sample. In this method the topographic feedback loop is disabled, and the tip is ramped towards the surface, then back. During the ramp the amplitude or frequency shift (depending on the mode of operation) is recorded to show the strength of the interaction at different distances. Force spectroscopy was originally performed in amplitude modulation mode,[22] but is now more commonly performed in frequency modulation. The force is not directly measured during the spectroscopy measurement, instead the frequency shift is measured which must then be converted into a force. The frequency shift can be calculated,[7] by:

where is the tip's oscillation from its equilibrium position, and are the sensors stiffness and resonant frequency, and is the amplitude of oscillation. The angle brackets represent an average of one oscillation cycle. However, turning a measures frequency shift into a force, which is necessary during a real experiment, is much more complicated. Two methods are commonly used for this conversion, the Sader-Jarvis method[23] and the Giessibl matrix method.[24]


For measurements of chemical forces the effect of the long range van der Waals forces must be subtracted from the frequency shift data. Originally this was done by fitting a power law to the long range 'tail' of the spectrum (when the tip is far from the surface) and extrapolating this over the short range interaction (tip close to the surface). This fitting, however, is very sensitive to where the cut-off between long and short range forces is chosen, causing results of questionable accuracy. Usually the most appropriate method is to perform two spectroscopy measurements, one over any molecule under study, and a second above a lower section of the clean surface, then to directly subtract the second from the first. This method is not applicable to features under study on a flat surface as no lower section may exist.
Grid spectroscopy
Grid spectroscopy is an extension of force spectroscopy described above. In grid spectroscopy multiple force spectra are taken in a grid over a surface, to build up a three-dimensional force map above the surface. These experiments can take a considerable time, often over 24 hours, thus the microscope is usually cooled with liquid helium or an atom tracking method is employed to correct for drift.[25]
Lateral force measurements
It is possible to perform lateral force measurements using a nc-AFM probe oscillating normal to the surface under study.[26] This method uses a similar method to force spectroscopy except the tip is moved parallel to the surface while the frequency shift is recorded, this is repeated at multiple heights above the surface, starting far from the surface and moving closer. After any change to the surface, for example moving an atom on the surface, the experiment is stopped. This leaves a 2D grid of measured frequency shifts. Using an appropriate force spectroscopy calculation each of the vertical frequency shift vectors can be converted into a vector of forces in the z-direction, thus creating a 2D grid of calculated forces. These forces can be integrated vertically to produce a 2D map of the potential. It is then possible to differentiate the potential horizontally to calculate the lateral forces. As this method relies on heavy mathematical processing, in which each state assumes a vertical motion of the tip, it is critical that the sensor is not angled, and that the tip length is very short compared to the length of the sensor.[17] A direct measurement of lateral forces is possible by using a torsional mode with a silicon cantilever [27] or by orienting the sensor to oscillate parallel to the surface.[28] Using the latter technique, Weymouth et al. measured the tiny interaction of two CO molecules as well as the lateral stiffness of a CO terminated tip.[29]
Notable results
nc-AFM was the first form of AFM to achieve true atomic resolution images, rather than averaging over multiple contacts, both on non-reactive and reactive surfaces.[30]
nc-AFM was the first form of microscopy to achieve subatomic resolution images, initially on tip atoms [31] and later on single iron adatoms on copper.[32]
nc-AFM was the first technique to directly image chemical bonds in real space,[33] see inset image. This resolution was achieved by picking up a single CO molecule on the apex of the tip.
nc-AFM has been used to probe the force interaction between a single pair of molecules.[34]
References
- ↑ Sweetman, A. M.; Jarvis, S. P.; Sang, Hongqian; Lekkas, I.; Rahe, P.; Wang, Yu; Wang, Jianbo; Champness, N.R.; Kantorovich, L.; Moriarty, P. (2014). "Mapping the force field of a hydrogen-bonded assembly". Nature Communications. 5. Bibcode:2014NatCo...5E3931S. doi:10.1038/ncomms4931.
- ↑ Albrecht, T. R.; Grütter, P.; Horne, D.; Rugar, D. (1991). "Frequency modulation detection using high-Q cantilevers for enhanced force microscope sensitivity". Journal of Applied Physics. 69 (2): 668. Bibcode:1991JAP....69..668A. doi:10.1063/1.347347. ISSN 0021-8979.
- ↑ Nony, Laurent; Baratoff, Alexis; Schär, Dominique; Pfeiffer, Oliver; Wetzel, Adrian; Meyer, Ernst (2006). "Noncontact atomic force microscopy simulator with phase-locked-loop controlled frequency detection and excitation". Physical Review B. 74 (23): 235439. arXiv:physics/0701343
 . Bibcode:2006PhRvB..74w5439N. doi:10.1103/PhysRevB.74.235439. ISSN 1098-0121.
 - 1 2 Binnig, G.; Quate, C. F.; Gerber, C (1986). "Atomic Force Microscope". Physical Review Letters. 56 (9): 930–933. Bibcode:1986PhRvL..56..930B. doi:10.1103/PhysRevLett.56.930. ISSN 0031-9007. PMID 10033323.
- ↑ Akamine, S.; Barrett, R. C.; Quate, C. F. (1990). "Improved atomic force microscope images using microcantilevers with sharp tips". Applied Physics Letters. 57 (3): 316. Bibcode:1990ApPhL..57..316A. doi:10.1063/1.103677.
- ↑ Albrecht, T. R. (1990). "Microfabrication of cantilever styli for the atomic force microscope". Journal of Vacuum Science and Technology A. 8 (4): 3386. doi:10.1116/1.576520.
- 1 2 Giessibl, Franz (1997). "Forces and frequency shifts in atomic-resolution dynamic-force microscopy". Physical Review B. 56 (24): 16010–16015. Bibcode:1997PhRvB..5616010G. doi:10.1103/PhysRevB.56.16010.
- ↑ Giessibl, F. J.; Trafas, B. M. (1994). "Piezoresistive cantilevers utilized for scanning tunneling and scanning force microscope in ultrahigh vacuum". Review of Scientific Instruments. 65 (6): 1923. Bibcode:1994RScI...65.1923G. doi:10.1063/1.1145232.
- ↑ Giessibl, Franz J. (1998). "High-speed force sensor for force microscopy and profilometry utilizing a quartz tuning fork". Applied Physics Letters. 73 (26): 3956. Bibcode:1998ApPhL..73.3956G. doi:10.1063/1.122948.
- ↑ Giessibl, Franz J. "Vorrichtung zum beruehrungslosen Abtasten einer Oberflaeche und Verfahren dafuer". German Patent DE 19633546, August 20, 1996, published Feb 26 1998.
- ↑ Majzik, Zsolt; Setvín, Martin; Bettac, Andreas; Feltz, Albrecht; Cháb, Vladimír; Jelínek, Pavel (2012). "Simultaneous current, force and dissipation measurements on the Si(111) 7×7 surface with an optimized qPlus AFM/STM technique". Beilstein Journal of Nanotechnology. 3: 249–259. doi:10.3762/bjnano.3.28. PMC 3323914. PMID 22496998.
- ↑ Giessibl, Franz J. "Sensor for noncontact profiling of a surface" U.S. Patent 8,393,009, priority date November 23, 2010, issued March 5, 2013
- ↑ https://www.youtube.com/watch?v=OOkbt16M3Mg
- ↑ Giessibl, Franz J. (2000). "Atomic resolution on Si(111)-(7×7) by noncontact atomic force microscopy with a force sensor based on a quartz tuning fork". Applied Physics Letters. 76 (11): 1470. Bibcode:2000ApPhL..76.1470G. doi:10.1063/1.126067.
- ↑ Sweetman, A.; Jarvis, S.; Danza, R.; Bamidele, J.; Kantorovich, L.; Moriarty, P. (2011). "Manipulating Si(100) at 5 K using qPlus frequency modulated atomic force microscopy: Role of defects and dynamics in the mechanical switching of atoms". Physical Review B. 84 (8): 085426. Bibcode:2011PhRvB..84h5426S. doi:10.1103/PhysRevB.84.085426.
- ↑ Giessibl, Franz; Pielmeier, Florian; Eguchi, Toyoaki; An, Toshio; Hasegawa, Yukio (2013). "Comparison of force sensors for atomic force microscopy based on quartz tuning forks and length-extensional resonators". Physical Review B. 84: 125409. arXiv:1104.2987. Bibcode:2011PhRvB..84l5409G. doi:10.1103/PhysRevB.84.125409.
- 1 2 Stirling, Julian; Shaw, Gordon A (2013). "Calculation of the effect of tip geometry on noncontact atomic force microscopy using a qPlus sensor". Beilstein Journal of Nanotechnology. 4: 10–19. doi:10.3762/bjnano.4.2. PMC 3566854. PMID 23400392.
- ↑ Meyer, Gerhard; Amer, Nabil M. (1988). "Novel optical approach to atomic force microscopy". Applied Physics Letters. 53 (12): 1045. Bibcode:1988ApPhL..53.1045M. doi:10.1063/1.100061.
- ↑ Bartzke, K.; Antrack, T.; Schmidt, K. H.; Dammann, E.; Schatterny, C. H. (1993). "Needle sensor a micromechanical detector for atomic force microscopy". International Journal of Optoelectronics. 8 (5/6): 669.
- ↑ Heyde, M.; Kulawik, M.; Rust, H.-P.; Freund, H.-J. (2004). "Double quartz tuning fork sensor for low temperature atomic force and scanning tunneling microscopy". Review of Scientific Instruments. 75 (7): 2446. Bibcode:2004RScI...75.2446H. doi:10.1063/1.1765753.
- ↑ Torbrügge, Stefan; Schaff, Oliver; Rychen, Jörg (2010). "Application of the KolibriSensor to combined atomic-resolution scanning tunneling microscopy and noncontact atomic-force microscopy imaging". Journal of Vacuum Science and Technology B. 28 (3): C4E12. doi:10.1116/1.3430544.
- ↑ Jarvis, S. P.; Yamada, H.; Yamamoto, S.-I.; Tokumoto, H.; Pethica, J. B. (1996). "Direct mechanical measurement of interatomic potentials". Nature. 384 (6606): 247–249. Bibcode:1996Natur.384..247J. doi:10.1038/384247a0.
- ↑ Sader, John E.; Jarvis, Suzanne P. (2004). "Accurate formulas for interaction force and energy in frequency modulation force spectroscopy". Applied Physics Letters. 84 (10): 1801. Bibcode:2004ApPhL..84.1801S. doi:10.1063/1.1667267.
- ↑ Giessibl, F. J. (2001). "A direct method to calculate tip–sample forces from frequency shifts in frequency-modulation atomic force microscopy". Applied Physics Letters. 78 (1): 123. Bibcode:2001ApPhL..78..123G. doi:10.1063/1.1335546.
- ↑ Rahe, Philipp; Schütte, Jens; Schniederberend, Werner; Reichling, Michael; Abe, Masayuki; Sugimoto, Yoshiaki; Kühnle, Angelika (2011). "Flexible drift-compensation system for precise 3D force mapping in severe drift environments". Review of Scientific Instruments. 82 (6): 063704. Bibcode:2011RScI...82f3704R. doi:10.1063/1.3600453. PMID 21721699.
- ↑ Ternes, M.; Lutz, C. P.; Hirjibehedin, C. F.; Giessibl, F. J.; Heinrich, A. J. (2008). "The Force Needed to Move an Atom on a Surface". Science. 319 (5866): 1066–1069. Bibcode:2008Sci...319.1066T. doi:10.1126/science.1150288. PMID 18292336.
- ↑ Pfeiffer, O.; Bennewitz, R. P.; Baratoff, A.; Meyer, E.; Grütter, P. J. (2002). "Lateral-force measurements in dynamic force microscopy". Physical Review B. 65 (16): 161403(R). doi:10.1103/physrevb.65.161403.
- ↑ Giessibl, F.J.; Herz, M. P.; Mannhart, J. (2002). "Friction traced to the single atom". PNAS. 99 (16): 12006. Bibcode:2002PNAS...9912006G. doi:10.1073/pnas.182160599.
- ↑ Weymouth, A.J.; Hofmann, T.; Giessibl, F.J. (2014). "Quantifying Molecular Stiffness and Interaction with Lateral Force Microscopy". Science. 343 (6175): 1120. Bibcode:2014Sci...343.1120W. doi:10.1126/science.1249502.
- ↑ Giessibl, Franz J. (2003). "Advances in atomic force microscopy". Reviews of Modern Physics. 75 (3): 949–983. arXiv:cond-mat/0305119. Bibcode:2003RvMP...75..949G. doi:10.1103/RevModPhys.75.949.
- ↑ Giessibl, F.J.; Hembacher, S.; Bielefeldt, H.; Mannhart, J. (2000). "Subatomic Features on the Silicon (111)-(7×7) Surface Observed by Atomic Force Microscopy". Science. 289 (5478): 422. Bibcode:2000Sci...289..422G. doi:10.1126/science.289.5478.422.
- ↑ Emmrich, M.; et al. (2015). "Subatomic resolution force microscopy reveals internal structure and adsorption sites of small iron clusters". Science. 348 (6232): 308. Bibcode:2015Sci...348..308E. doi:10.1126/science.aaa5329.
- ↑ Gross, L.; Mohn, F.; Moll, N.; Liljeroth, P.; Meyer, G. (2009). "The Chemical Structure of a Molecule Resolved by Atomic Force Microscopy". Science. 325 (5944): 1110–1114. Bibcode:2009Sci...325.1110G. doi:10.1126/science.1176210. PMID 19713523.
- ↑ Chiutu, C.; Sweetman, A. M.; Lakin, A. J.; Stannard, A.; Jarvis, S.; Kantorovich, L.; Dunn, J. L.; Moriarty, P. (2012). "Precise Orientation of a Single C_{60} Molecule on the Tip of a Scanning Probe Microscope". Physical Review Letters. 108 (26): 268302. Bibcode:2012PhRvL.108z8302C. doi:10.1103/PhysRevLett.108.268302. PMID 23005019.
| Wikimedia Commons has media related to Non-contact atomic force microscopy. |