Random—Burin—St. George's
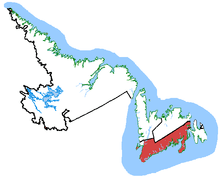 Random—Burin—St. George's in relation to other Newfoundland and Labrador ridings | |
| Defunct federal electoral district | |
| Legislature | House of Commons |
| District created | 2003 |
| District abolished | 2013 |
| First contested | 2004 |
| Last contested | 2011 |
| District webpage | profile, map |
| Demographics | |
| Population (2011)[1] | 69,192 |
| Electors (2011) | 57,209 |
| Area (km²)[2] | 34,095.30 |
| Census divisions | Division No. 2, Division No. 3, Division No. 4, Division No. 6 |
| Census subdivisions | Stephenville, Marystown, Clarenville, Channel-Port aux Basques, Grand Bank, Burin |
Random—Burin—St. George's was a federal electoral district in Newfoundland and Labrador, Canada, that was represented in the Canadian House of Commons from 2004 to 2015.
Demographics
Ethnic groups: 94.7% White, 4.8% Native Canadian
Languages: 98.5% English
Religions: 54.6% Protestant, 43.8% Catholic, 1.3% No affiliation
Average income: $19 018
Geography
The district includes the south coast of the island of Newfoundland, the Stephenville area, the Burin Peninsula, and the west-central coast of Trinity Bay including Random Island, Brunette Island, Long Island, Merasheen Island, Red Island and the Ramea Islands.
The neighbouring ridings are Avalon, Bonavista—Gander—Grand Falls—Windsor, and Humber—St. Barbe—Baie Verte, as well as the French Collectivité d'outre-mer (Overseas Community) of St-Pierre-et-Miquelon.
According to Elections Canada, the boundaries of this riding for the 39th General Election are:
- "All that area consisting of that part of the Island of Newfoundland lying southerly and westerly of a line described as follows: commencing at Bluff Head on the eastern shoreline of Port au Port Bay; thence easterly in a straight line to Georges Lake; thence easterly in a straight line to the mouth of Lloyds River at the westernmost extremity of Red Indian Lake; thence southerly in a straight line to a point in Victoria Lake at latitude 48°15'N and approximate longitude 57°21'W; thence generally easterly to the intersection of the Trans-Canada Highway (Route No. 1) with Route No. 230; thence easterly along Route No. 230 to Route No. 230A; thence easterly in a straight line to Ocean Pond; thence southeasterly in a straight line to British Harbour at the entrance of Smith Sound on the north shoreline of Trinity Bay; thence southeasterly to said bay; thence southerly along Trinity Bay to the easterly production in Trinity Bay of the northerly limit of the Town of Sunnyside; thence westerly along said production and said northerly limit to the Trans-Canada Highway (Route No. 1); thence southerly along said highway to the northerly limit of the Town of Come By Chance; thence westerly and southerly along the northerly and westerly limits of said town to the shoreline of Placentia Bay; thence southerly along the Eastern Channel of Placentia Bay and Placentia Bay to a point approximately 20 km west of Cape St. Mary's. Including Random Island, Ireland's Eye, Merasheen Island, Red Island, Long Island, Green Island, Brunette Island, Penguin Islands, Ramea Islands and all other islands adjacent to the shoreline of the above-described area."
See the map of the Random—Burin—St. George's riding (.PDF).
History
The electoral district was created in 2003: 87.1% of the population of the riding came from Burin—St. George's, 12.9% from Bonavista—Trinity—Conception, and 0.1% from Humber—St. Barbe—Baie Verte. The incumbent for Burin—St. George's riding was Bill Matthews of the Liberal Party of Canada. As of the 2012 federal electoral redistribution, this riding will be dissolved and divided between Bonavista—Burin—Trinity (45%), Long Range Mountains (44%) and Coast of Bays—Central—Notre Dame (11%).
This riding has elected the following Members of Parliament:
| Parliament | Years | Member | Party | |
|---|---|---|---|---|
| Random—Burin—St. George's Riding created from Burin—St. George's, Bonavista—Trinity—Conception and Humber—St. Barbe—Baie Verte |
||||
| 38th | 2004–2006 | Bill Matthews | Liberal | |
| 39th | 2006–2008 | |||
| 40th | 2008–2011 | Judy Foote | Liberal | |
| 41st | 2011–2015 | |||
| Riding dissolved into Bonavista—Burin—Trinity, Long Range Mountains and Coast of Bays—Central—Notre Dame |
||||
Election results
Random—Burin—St. George's, 2003 Representation Order
| Canadian federal election, 2011 | ||||||||
|---|---|---|---|---|---|---|---|---|
| Party | Candidate | Votes | % | ∆% | Expenditures | |||
| Liberal | Judy Foote | 12,914 | 49.65 | -4.10 | $31,470.79 | |||
| Conservative | John Ottenheimer | 8,322 | 32.00 | +11.49 | $58,392.45 | |||
| New Democratic | Stella Magalios | 4,465 | 17.17 | -6.60 | $9.13 | |||
| Green | Tanya Gutmanis | 307 | 1.18 | -0.80 | none listed | |||
| Total valid votes/Expense limit | 26,008 | 100.0 | – | $94,623.02 | ||||
| Total rejected, unmarked and declined ballots | 120 | 0.46 | +0.06 | |||||
| Turnout | 26,128 | 45.80 | +4.73 | |||||
| Eligible voters | 57,047 | |||||||
| Liberal hold | Swing | -7.80 | ||||||
| Sources: [3] [4] | ||||||||
| Canadian federal election, 2008 | ||||||||
|---|---|---|---|---|---|---|---|---|
| Party | Candidate | Votes | % | ∆% | Expenditures | |||
| Liberal | Judy Foote | 12,557 | 53.75 | +8.26 | $27,863.09 | |||
| New Democratic | Terry White | 5,553 | 23.77 | +11.43 | $5,574.70 | |||
| Conservative | Herb Davis | 4,791 | 20.51 | -20.25 | $86,684.21 | |||
| Green | Kaitlin Wainwright | 462 | 1.98 | +0.56 | none listed | |||
| Total valid votes/Expense limit | 23,363 | 100.0 | – | $91,604 | ||||
| Total rejected, unmarked and declined ballots | 122 | 0.52 | +0.09 | |||||
| Turnout | 23,495 | 41.07 | -11.4 | |||||
| Eligible voters | 57,209 | |||||||
| Liberal hold | Swing | -3.17 | ||||||
| Canadian federal election, 2006 | ||||||||
|---|---|---|---|---|---|---|---|---|
| Party | Candidate | Votes | % | ∆% | Expenditures | |||
| Liberal | Bill Matthews | 13,652 | 45.49 | -1.28 | $24,312.48 | |||
| Conservative | Cynthia Downey | 12,232 | 40.76 | +22.55 | $27,919.55 | |||
| New Democratic | Amanda Will | 3,702 | 12.34 | -20.95 | $842.43 | |||
| Green | Mark A. Brennan | 426 | 1.42 | -0.37 | none listed | |||
| Total valid votes/Expense limit | 30,012 | 100.0 | – | $85,393 | ||||
| Total rejected ballots | 131 | 0.43 | -0.09 | |||||
| Turnout | 30,143 | 52.09 | +7.18 | |||||
| Eligible voters | 57,869 | |||||||
| Liberal hold | Swing | -11.92 | ||||||
| Canadian federal election, 2004 | ||||||||
|---|---|---|---|---|---|---|---|---|
| Party | Candidate | Votes | % | ∆% | Expenditures | |||
| Liberal | Bill Matthews | 12,383 | 46.77 | -1.03 | $32,788.03 | |||
| New Democratic | Desmond McGrath | 8,797 | 33.29 | +28.76 | $29,123.91 | |||
| Conservative | Larry Peckford | 4,820 | 18.21 | -7.18 | $35,579.47 | |||
| Green | Justin Dollimont | 474 | 1.79 | – | $468.70 | |||
| Total valid votes/Expense limit | 26,474 | 100.0 | – | $83,804 | ||||
| Total rejected, unmarked and declined ballots | 139 | 0.52 | ||||||
| Turnout | 26,613 | 44.91 | -12.34 | |||||
| Eligible voters | 59,256 | |||||||
| Liberal notional hold | Swing | -14.90 | ||||||
| Changes from 2000 are based on redistributed results. Change for the Conservatives is based on the combined totals of the Progressive Conservatives and the Canadian Alliance. | ||||||||
| 2000 federal election redistributed results | |||
|---|---|---|---|
| Party | Vote | % | |
| Liberal | 16,523 | 47.80 | |
| Independent | 7,702 | 22.28 | |
| Progressive Conservative | 7,211 | 20.86 | |
| Alliance | 1,567 | 4.53 | |
| New Democratic | 1,565 | 4.53 | |
See also
References
- "(Code 10005) Census Profile". 2011 census. Statistics Canada. 2012. Retrieved 2011-03-03.
Notes
External links
- Random—Burin—St. George's riding from Elections Canada
- Riding history for Random—Burin—St. George's (2003– ) from the Library of Parliament
- Election Financial Reports from Elections Canada
Coordinates: 47°44′56″N 57°23′40″W / 47.7489°N 57.3944°W