Cumberland—Colchester
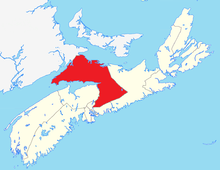 Cumberland–Colchester–Musquodoboit Valley in relation to the other Nova Scotia federal electoral districts | |||
| Federal electoral district | |||
| Legislature | House of Commons | ||
| MP |
| ||
| District created | 1966 | ||
| First contested | 2004 | ||
| Last contested | 2015 | ||
| District webpage | profile, map | ||
| Demographics | |||
| Population (2011)[1] | 82,321 | ||
| Electors (2015) | 64,923 | ||
| Area (km²)[1] | 8,269 | ||
| Pop. density (per km²) | 10 | ||
| Census divisions | Colchester, Cumberland, Halifax | ||
| Census subdivisions | Halifax, Truro, Amherst, Springhill | ||
Cumberland—Colchester (formerly Cumberland—Colchester—Musquodoboit Valley and North Nova) is a federal electoral district in Nova Scotia, Canada, that has been represented in the House of Commons of Canada since 2004. Its population in 2011 was 82,321.
Cumberland—Colchester North and Cumberland—Colchester were ridings that covered roughly the same geographic area and were represented in the House of Commons from 1968 to 1979 and 1979 to 2004, respectively.
Demographics
| Historical population | ||
|---|---|---|
| Year | Pop. | ±% |
| 2001 | 87,149 | — |
| 2006 | 87,895 | +0.9% |
| 2011 | 87,982 | +0.1% |
From the 2006 census [2]
Ethnic groups:
- White: 96.1%
- First Nations: 1.9%
- Black: 1.2%
Languages:
Religions:
- Protestant: 65.7%
- Catholic: 17.5%
- Other Christian: 1.3%
- No religious affiliation: 15.1%
Education:
- No certificate, diploma or degree: 31.0%
- High school certificate: 24.6%
- Apprenticeship or trade certificate or diploma: 12.3%
- Community college, CEGEP or other non-university certificate or diploma: 17.7%
- University certificate or diploma: 14.3%
Median Age:
- 43.4
Median total income:
- $20,756
Average total income:
- $26,779
Median household income:
- $41,550
Average household income:
- $50,122
Median family income:
- $50,353
Average family income:
- $58,555
Unemployment:
- 9.0%
Geography
The district includes the counties of Cumberland, and Colchester and the northeastern part of the Halifax Regional Municipality. Communities include the towns of Amherst, Oxford, Parrsboro, Springhill, Stewiacke and Truro, as well as the villages of Bible Hill, Pugwash and Tatamagouche. It includes the Musquodoboit Valley region, the Halifax International Airport and the Aerotech Business Park within Halifax Regional Municipality. The riding's area is 10,086 km2.
History
This riding was created as "Cumberland—Colchester North" in 1966 from Cumberland and Colchester—Hants ridings. It consisted of the county of Cumberland and the northern part of the county of Colchester, including the town of Truro. It was abolished in 1976 when it was merged with the remainder of Colchester County into "Cumberland—Colchester" riding.
Cumberland–Colchester was abolished in 2003. The territory was combined with the largely rural Musquodoboit Valley portion of the Halifax Regional Municipality in a new riding called "North Nova". After the election in 2004, the name was changed to "Cumberland—Colchester—Musquodoboit Valley".
2009 By-election
In early 2009, Incumbent Bill Casey announced he would not be re-offering in the next Federal Election. He subsequently announced his resignation from Parliament to become the Senior Inter-Governmental Affairs Representative for Nova Scotia in Ottawa.
In April 2009 Scott Armstrong was confirmed as the next Conservative Party candidate in the riding. At the time, he was the president of the provincial Progressive Conservative Party.
In September 2009, Jim Burrows was selected as the next Liberal Party candidate in the riding having defeated 2008 candidate, Tracy Parsons. He received 175 of 206 votes cast. He is a dairy farmer from Green Oaks and Chair of the Board of Directors for Scotsburn Co-operative Services.[3]
Mark Austin was selected to run for the New Democratic Party.
Christian Heritage Party ran Jim Hnatiuk, a retired military officer and the owner of Nova Scotia’s largest hunting and fishing store, in Lantz. Hnatiuk was chosen party leader in November 2008.
Green Party leader Elizabeth May had said she was interested in running in the by-election, but since announced she will run in the riding of Saanich-Gulf Islands. The party instead ran Jason Blanch.
As per the 2012 federal electoral redistribution, this riding was largely dissolved into the new riding 'Cumberland—Colchester', with small portions going to Central Nova and Sackville—Preston—Chezzetcook.
Member of Parliament
These ridings have elected the following Members of Parliament:
| Parliament | Years | Member | Party | |
|---|---|---|---|---|
| Cumberland—Colchester North Riding created from Cumberland and Colchester—Hants |
||||
| 28th | 1968–1972 | Robert Coates | Progressive Conservative | |
| 29th | 1972–1974 | |||
| 30th | 1974–1979 | |||
| Cumberland—Colchester | ||||
| 31st | 1979–1980 | Robert Coates | Progressive Conservative | |
| 32nd | 1980–1984 | |||
| 33rd | 1984–1988 | |||
| 34th | 1988–1993 | Bill Casey | ||
| 35th | 1993–1997 | Dianne Brushett | Liberal | |
| 36th | 1997–2000 | Bill Casey | Progressive Conservative | |
| 37th | 2000–2003 | |||
| 2003–2004 | Conservative | |||
| North Nova | ||||
| 38th | 2004–2006 | Bill Casey | Conservative | |
| Cumberland—Colchester—Musquodoboit Valley | ||||
| 39th | 2006–2007 | Bill Casey | Conservative | |
| 2007–2008 | Independent | |||
| 40th | 2008–2009 | |||
| 2009–2011 | Scott Armstrong | Conservative | ||
| 41st | 2011–2015 | |||
| Cumberland—Colchester | ||||
| 42nd | 2015–Present | Bill Casey | Liberal | |
Election results
Cumberland—Colchester, 2013 Representation Order
| Canadian federal election, 2015 | ||||||||
|---|---|---|---|---|---|---|---|---|
| Party | Candidate | Votes | % | ∆% | Expenditures | |||
| Liberal | Bill Casey | 29,527 | 63.73 | +45.35 | – | |||
| Conservative | Scott Armstrong | 12,257 | 26.45 | –26.48 | – | |||
| New Democratic | Wendy Robinson | 2,647 | 5.71 | –16.76 | – | |||
| Green | Jason Matthew Blanch | 1,650 | 3.56 | –1.81 | – | |||
| Independent | Kenneth Jackson | 181 | 0.39 | – | – | |||
| Independent | Richard Trueman Plett | 70 | 0.15 | – | – | |||
| Total valid votes/Expense limit | 46,332 | 100.00 | $206,116.04 | |||||
| Total rejected ballots | 178 | 0.38 | ||||||
| Turnout | 46,510 | 71.64 | ||||||
| Eligible voters | 64,923 | |||||||
| Liberal gain from Conservative | Swing | +35.91 | ||||||
| Source: Elections Canada[4][5] | ||||||||
| 2011 federal election redistributed results[6] | |||
|---|---|---|---|
| Party | Vote | % | |
| Conservative | 19,875 | 52.93 | |
| New Democratic | 8,439 | 22.48 | |
| Liberal | 6,902 | 18.38 | |
| Green | 2,015 | 5.37 | |
| Others | 314 | 0.84 | |
Cumberland—Colchester—Musquodoboit Valley, 2003 Representation Order
2011 federal election
| Canadian federal election, 2011 | ||||||||
|---|---|---|---|---|---|---|---|---|
| Party | Candidate | Votes | % | ∆% | Expenditures | |||
| Conservative | Scott Armstrong | 21,041 | 52.46 | +6.62 | $84,480.51 | |||
| New Democratic | Wendy Robinson | 9,322 | 23.24 | -2.49 | $10,734.51 | |||
| Liberal | Jim Burrows | 7,264 | 18.11 | -3.21 | $34,804.26 | |||
| Green | Jason Blanch | 2,109 | 5.26 | +1.95 | $5,762.34 | |||
| Christian Heritage | Jim Hnatiuk | 375 | 0.93 | -2.26 | $5,478.83 | |||
| Total valid votes/Expense limit | 40,111 | 100.00 | $87,350.74 | |||||
| Total rejected, unmarked and declined ballots | 256 | 0.63 | +0.23 | |||||
| Turnout | 40,367 | 58.34 | +22.53 | |||||
| Eligible voters | 69,188 | |||||||
| Conservative hold | Swing | +4.56 | ||||||
| Changes based on 2009 by-election results. | ||||||||
| Sources:[7][8] | ||||||||
2009 by-election
| Canadian federal by-election, November 9, 2009 | ||||||||
|---|---|---|---|---|---|---|---|---|
| Party | Candidate | Votes | % | ∆% | Expenditures | |||
| Conservative | Scott Armstrong | 11,167 | 45.84 | +37.01 | $85,124.62 | |||
| New Democratic | Mark Austin | 6,267 | 25.73 | +13.41 | $70,020.79 | |||
| Liberal | Jim Burrows | 5,193 | 21.32 | +12.87 | $59,031.48 | |||
| Green | Jason Blanch | 807 | 3.31 | – | $3,338.63 | |||
| Christian Heritage | Jim Hnatiuk | 778 | 3.19 | – | $61,482.45 | |||
| Independent | Kate Graves | 149 | 0.61 | – | $1,108.02 | |||
| Total valid votes/Expense limit | 24,361 | 100.0 | $86,242 | |||||
| Total rejected, unmarked and declined ballots | 97 | 0.40 | -0.11 | |||||
| Turnout | 24,458 | 35.81 | -21.96 | |||||
| Eligible voters | 68,304 | |||||||
| Conservative gain from Independent | Swing | +11.80 | ||||||
| By-election called on the resignation of Bill Casey | ||||||||
2008 federal election
Incumbent MP Bill Casey, re-elected in 2006 as a member of the Conservative Party, was expelled from the Conservative caucus in 2007 after voting against the 2007 budget, which he objected to on the grounds of alleged violations of the Atlantic Accord. He attempted to run for the Conservative nomination for the next federal election but was refused. Casey therefore ran for re-election as an independent. The Green Party endorsed Casey and did not nominate a candidate opposing his reelection.
| Canadian federal election, 2008 | ||||||||
|---|---|---|---|---|---|---|---|---|
| Party | Candidate | Votes | % | ∆% | Expenditures | |||
| Independent | Bill Casey | 27,303 | 69.01 | +16.97 | $68,549.58 | |||
| New Democratic | Karen Olsson | 4,874 | 12.32 | -8.42 | $6,944.11 | |||
| Conservative | Joel Bernard | 3,493 | 8.83 | -43.21 | $35,846.73 | |||
| Liberal | Tracy Parsons | 3,344 | 8.45 | -15.44 | $28,266.26 | |||
| Independent | Rick Simpson | 550 | 1.39 | +0.17 | none listed | |||
| Total valid votes/Expense limit | 39,564 | 100.0 | $84,518 | |||||
| Total rejected, unmarked and declined ballots | 201 | 0.51 | +0.04 | |||||
| Turnout | 39,765 | 57.77 | -4.08 | |||||
| Eligible voters | 68,831 | |||||||
| Independent gain from Conservative | Swing | +12.68 | ||||||
2006 federal election
| Canadian federal election, 2006 | ||||||||
|---|---|---|---|---|---|---|---|---|
| Party | Candidate | Votes | % | ∆% | Expenditures | |||
| Conservative | Bill Casey | 22,439 | 52.04 | +1.55 | $50,744.39 | |||
| Liberal | Gary Richard | 10,299 | 23.89 | -2.60 | $30,783.20 | |||
| New Democratic | Margaret Sagar | 8,944 | 20.74 | +1.83 | $15,901.38 | |||
| Green | Bruce Farrell | 910 | 2.11 | -1.00 | $118.51 | |||
| Independent | Rick Simpson | 524 | 1.22 | – | $253.00 | |||
| Total valid votes/Expense limit | 43,116 | 100.0 | $79,110 | |||||
| Total rejected, unmarked and declined ballots | 203 | 0.47 | -0.01 | |||||
| Turnout | 43,319 | 61.85 | ||||||
| Eligible voters | 70,036 | |||||||
| Conservative hold | Swing | +2.08 | ||||||
North Nova, 2003 Representation Order
| Canadian federal election, 2004 | ||||||||
|---|---|---|---|---|---|---|---|---|
| Party | Candidate | Votes | % | ∆% | Expenditures | |||
| Conservative | Bill Casey | 20,188 | 50.49 | -9.99 | $63,528.46 | |||
| Liberal | Dianne Brushett | 10,591 | 26.49 | +0.13 | $40,391.55 | |||
| New Democratic | Margaret Sagar | 7,560 | 18.91 | +5.87 | $14,509.58 | |||
| Green | Sheila Richardson | 1,245 | 3.11 | – | $1,050.38 | |||
| Progressive Canadian | Jack Moors | 399 | 1.00 | – | $553.10 | |||
| Total valid votes/Expense limit | 39,983 | 100.0 | $76,024 | |||||
| Total rejected, unmarked and declined ballots | 192 | 0.48 | ||||||
| Turnout | 40,175 | 60.46 | -0.32 | |||||
| Eligible voters | 66,451 | |||||||
| Conservative notional gain from Progressive Conservative | Swing | -5.06 | ||||||
| Changes from 2000 are based on redistributed results. Conservative Party change is based on the combination of Canadian Alliance and Progressive Conservative Party totals. | ||||||||
| 2000 federal election redistributed results | |||
|---|---|---|---|
| Party | Vote | % | |
| Progressive Conservative | 18,984 | 47.38 | |
| Liberal | 10,563 | 26.36 | |
| Alliance | 5,247 | 13.10 | |
| New Democratic | 5,226 | 13.04 | |
| Others | 48 | 0.12 | |
Cumberland—Colchester
| Canadian federal election, 2000 | ||||||||
|---|---|---|---|---|---|---|---|---|
| Party | Candidate | Votes | % | ∆% | ||||
| Progressive Conservative | Bill Casey | 18,716 | 48.49 | +4.86 | ||||
| Liberal | Dianne Brushett | 10,271 | 26.61 | +0.82 | ||||
| Alliance | Bryden Ryan | 4,981 | 12.91 | -1.08 | ||||
| New Democratic | James Harpell | 4,629 | 11.99 | -2.21 | ||||
| Total valid votes | 38,597 | 100.00 | ||||||
Changes for the Canadian Alliance from 1997 are based on its predecessor, the Reform Party.
| Canadian federal election, 1997 | ||||||||
|---|---|---|---|---|---|---|---|---|
| Party | Candidate | Votes | % | ∆% | ||||
| Progressive Conservative | Bill Casey | 18,610 | 43.63 | +7.15 | ||||
| Liberal | Dianne Brushett | 11,002 | 25.79 | -16.80 | ||||
| New Democratic | Peter Stewart | 6,058 | 14.20 | +8.64 | ||||
| Reform | Bob Peterson | 5,970 | 13.99 | +0.80 | ||||
| Independent | Ray Merriam | 826 | 1.94 | |||||
| Natural Law | Phyllis Hall | 193 | 0.45 | -0.28 | ||||
| Total valid votes | 42,659 | 100.00 | ||||||
| Canadian federal election, 1993 | ||||||||
|---|---|---|---|---|---|---|---|---|
| Party | Candidate | Votes | % | ∆% | ||||
| Liberal | Dianne Brushett | 18,195 | 42.59 | +1.03 | ||||
| Progressive Conservative | Bill Casey | 15,582 | 36.48 | -9.71 | ||||
| Reform | Audrey Staples | 5,636 | 13.19 | |||||
| New Democratic | Barbara Jack | 2,374 | 5.56 | -3.76 | ||||
| Christian Heritage | Steve McLean | 618 | 1.45 | -1.02 | ||||
| Natural Law | Phyllis Hall | 312 | 0.73 | |||||
| Total valid votes | 42,717 | 100.00 | ||||||
| Canadian federal election, 1988 | ||||||||
|---|---|---|---|---|---|---|---|---|
| Party | Candidate | Votes | % | ∆% | ||||
| Progressive Conservative | Bill Casey | 20,384 | 46.19 | -11.10 | ||||
| Liberal | Dennis James | 18,340 | 41.56 | +11.96 | ||||
| New Democratic | Barbara Jack | 4,112 | 9.32 | -3.78 | ||||
| Christian Heritage | Norman W. Pearce | 1,088 | 2.47 | |||||
| Independent | Bob Kirk | 210 | 0.48 | |||||
| Total valid votes | 44,134 | 100.00 | ||||||
| Canadian federal election, 1984 | ||||||||
|---|---|---|---|---|---|---|---|---|
| Party | Candidate | Votes | % | ∆% | ||||
| Progressive Conservative | Robert Coates | 24,180 | 57.30 | +11.00 | ||||
| Liberal | Ron Creighton | 12,489 | 29.60 | -4.90 | ||||
| New Democratic | Jessie Mae McCarron | 5,527 | 13.10 | -4.76 | ||||
| Total valid votes | 42,196 | 100.00 | ||||||
| Canadian federal election, 1980 | ||||||||
|---|---|---|---|---|---|---|---|---|
| Party | Candidate | Votes | % | ∆% | ||||
| Progressive Conservative | Robert Coates | 18,436 | 46.30 | -9.46 | ||||
| Liberal | Walter Purdy | 13,737 | 34.50 | +4.81 | ||||
| New Democratic | Hayden Trenholm | 7,111 | 17.86 | +4.03 | ||||
| Independent | Bob Kirk | 337 | 0.85 | +0.12 | ||||
| Independent | Dean Whalen | 194 | 0.49 | |||||
| Total valid votes | 39,815 | 100.00 | ||||||
| Canadian federal election, 1979 | ||||||||
|---|---|---|---|---|---|---|---|---|
| Party | Candidate | Votes | % | ∆% | ||||
| Progressive Conservative | Robert Coates | 22,827 | 55.76 | +2.97 | ||||
| Liberal | Sam Brushett | 12,154 | 29.69 | -10.22 | ||||
| New Democratic | Hayden Trenholm | 5,662 | 13.83 | +6.91 | ||||
| Independent | Bob Kirk | 297 | 0.73 | – | ||||
| Total valid votes | 40,940 | 100.00 | ||||||
Cumberland–Colchester North
| Canadian federal election, 1974 | ||||||||
|---|---|---|---|---|---|---|---|---|
| Party | Candidate | Votes | % | ∆% | ||||
| Progressive Conservative | Robert Coates | 18,078 | 52.79 | -5.29 | ||||
| Liberal | Sam Brushett | 13,666 | 39.91 | +9.57 | ||||
| New Democratic | Allan Marchbank | 2,369 | 6.92 | -3.93 | ||||
| Social Credit | Beatrice Holmes | 133 | 0.39 | |||||
| Total valid votes | 34,246 | 100.00 | ||||||
| Canadian federal election, 1972 | ||||||||
|---|---|---|---|---|---|---|---|---|
| Party | Candidate | Votes | % | ∆% | ||||
| Progressive Conservative | Robert Coates | 19,455 | 58.08 | -2.84 | ||||
| Liberal | Dick van Snick | 10,163 | 30.34 | -3.14 | ||||
| New Democratic | Allan Marchbank | 3,635 | 10.85 | +5.25 | ||||
| Independent | Robert Kirk | 245 | 0.73 | |||||
| Total valid votes | 33,498 | 100.00 | ||||||
| Canadian federal election, 1968 | ||||||||
|---|---|---|---|---|---|---|---|---|
| Party | Candidate | Votes | % | |||||
| Progressive Conservative | Robert Coates | 18,446 | 60.92 | |||||
| Liberal | Harry Flemming | 10,139 | 33.48 | |||||
| New Democratic | Gordon Schurman | 1,696 | 5.60 | |||||
| Total valid votes | 30,281 | 100.00 | ||||||
See also
References
- "(Code 12007) Census Profile". 2011 census. Statistics Canada. 2012. Retrieved 2011-03-03.
Notes
- 1 2 Statistics Canada: 2012
- ↑ http://www.bcstats.gov.bc.ca/data/cen06/profiles/detailed/FED12007.pdf Cumberland-Colchester-Musquodobit Valley's census profile
- ↑ http://www.trurodaily.com/index.cfm?sid=285939&sc=68
- ↑ "October 19, 2015 Election Results — Cumberland—Colchester (Validated results)". Elections Canada. 21 October 2015. Retrieved 24 October 2015.
- ↑ Elections Canada – Preliminary Election Expenses Limits for Candidates Archived August 15, 2015, at the Wayback Machine.
- ↑ Pundits' Guide to Canadian Elections
- ↑ Elections Canada – Official voting results, Forty-first general election, 2011
- ↑ Elections Canada – Candidate's electoral campaign return, 41st general election
External links
- Riding history for Cumberland–Colchester North (1966–1976) from the Library of Parliament
- Riding history for Cumberland–Colchester (1976–2003) from the Library of Parliament
- Riding history for North Nova (2003–2004) from the Library of Parliament
- Riding history for Cumberland–Colchester–Musquodoboit Valley (2004– ) from the Library of Parliament