Halifax (electoral district)
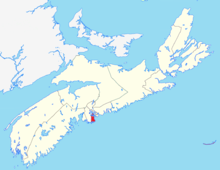 Halifax in relation to the other Nova Scotia federal electoral districts (2003 boundaries) | |||
| Federal electoral district | |||
| Legislature | House of Commons | ||
| MP |
| ||
| District created | 1867 | ||
| First contested | 1867 | ||
| Last contested | 2015 | ||
| District webpage | profile, map | ||
| Demographics | |||
| Population (2011)[1] | 92,643 | ||
| Electors (2015) | 71,363 | ||
| Area (km²)[1] | 244 | ||
| Pop. density (per km²) | 379.7 | ||
| Census divisions | Halifax | ||
| Census subdivisions | Halifax | ||
Halifax is a federal electoral district in Nova Scotia, Canada, is one of a handful of ridings which has been represented continuously (albeit with different boundaries) in the House of Commons since Confederation in 1867.
The riding of Halifax includes the communities of Spryfield, Sambro, Herring Cove, Harrietsfield, Williamswood, Prospect, Purcell's Cove, Armdale, Cowie Hill, Fairmount, Kline Heights, and the peninsula of Halifax.
History
The electoral district was created at Confederation in 1867. It returned two members until 1968.
The most notable of the riding's MPs was Robert Borden, who was Conservative leader from 1901–1920, and Prime Minister of Canada from 1911-1920. Borden represented the riding from 1896–1904 and again from 1909-1917. Another notable MP was Robert Stanfield, leader of the Progressive Conservative Party from 1967-1976, who represented the riding from 1968-1979.
Halifax was represented by the New Democratic Party from 1997 to 2015, with the Liberal Party coming in second in every election from 2000 to 2015. The riding's boundaries were re-distributed in 2004. Before that date, it comprised the peninsula of Halifax, the community of Fairview, and part of Clayton Park.
Alexa McDonough, who represented stepped down as NDP leader in 2003, but stayed on to represent Halifax in the House of Commons. McDonough ran for re-election against popular city councillor Sheila Fougere in 2004, who came within 1000 votes of beating the incumbent. McDonough pulled ahead based in part on a strong showing in Halifax's North End. On June 2, 2008, McDonough announced that she would not seek re-election.[2]
Following the 2012 redistribution, the riding will be gaining a small part of the riding of Halifax West, on the eastern side of Long Lake Provincial Park.
Demographics
| Historical population | ||
|---|---|---|
| Year | Pop. | ±% |
| 2001 | 88,931 | — |
| 2006 | 89,448 | +0.6% |
| 2011 | 92,515 | +3.4% |
- According to the Canada 2011 Census; 2013 representation[3][4]
Ethnic groups: 84.4% White, 4.2% Black, 2.4% Chinese, 2.4% Arab, 2.2% Aboriginal, 1.4% South Asian
Languages: 87.5% English, 2.9% French, 2.0% Chinese, 2.0% Arabic
Religions: 61.1% Christian (28.8% Catholic, 9.4% Anglican, 8.0% United Church, 4.6% Baptist, 1.3% Presbyterian, 1.3% Christian Orthodox, 7.7% Other), 3.4% Muslim, 32.4% No religion
Median income (2010): $28,027
Average income (2010): $40,088
Geography
The district includes the old city of Halifax except for the extreme western part, the area along the west coast of Halifax Harbour and along the Atlantic Ocean until Pennant. It also includes Sable Island. The area is 231 km2.
Members of Parliament
This riding has elected the following Members of Parliament:
Election results
Halifax, 2013 Representation Order
| Canadian federal election, 2015 | ||||||||
|---|---|---|---|---|---|---|---|---|
| Party | Candidate | Votes | % | ∆% | Expenditures | |||
| Liberal | Andy Fillmore | 27,431 | 51.73 | +26.08 | – | |||
| New Democratic | Megan Leslie | 19,162 | 36.13 | –15.48 | – | |||
| Conservative | Irvine Carvery | 4,564 | 8.61 | –9.41 | – | |||
| Green | Thomas Trappenberg | 1,745 | 3.29 | –1.10 | – | |||
| Marxist–Leninist | Allan Bezanson | 130 | 0.25 | -0.09 | – | |||
| Total valid votes/Expense limit | 53,032 | 100.00 | $202,243.99 | |||||
| Total rejected ballots | 259 | 0.49 | ||||||
| Turnout | 53,291 | 74.68 | ||||||
| Eligible voters | 71,363 | |||||||
| Liberal gain from New Democratic | Swing | +20.78 | ||||||
| Source: Elections Canada[5][6] | ||||||||
| 2011 federal election redistributed results[7] | |||
|---|---|---|---|
| Party | Vote | % | |
| New Democratic | 23,761 | 51.62 | |
| Liberal | 11,805 | 25.64 | |
| Conservative | 8,292 | 18.01 | |
| Green | 2,023 | 4.39 | |
| Marxist-Leninist | 152 | 0.33 | |
Halifax, 2003 Representation Order
| Canadian federal election, 2011 | ||||||||
|---|---|---|---|---|---|---|---|---|
| Party | Candidate | Votes | % | ∆% | Expenditures | |||
| New Democratic | Megan Leslie | 23,746 | 51.64 | +8.89 | $82,238.55 | |||
| Liberal | Stan Kutcher | 11,793 | 25.64 | -1.94 | $78,191.23 | |||
| Conservative | George Nikolaou | 8,276 | 18.00 | -2.62 | $48,637.42 | |||
| Green | Michael Dewar | 2,020 | 4.39 | -4.26 | $1,663.22 | |||
| Marxist–Leninist | Tony Seed | 152 | 0.33 | -0.07 | none listed | |||
| Total valid votes/Expense limit | 45,987 | 100.0 | $84,606.68 | |||||
| Total rejected, unmarked and declined ballots | 241 | 0.52 | +0.01 | |||||
| Turnout | 46,228 | 63.02 | +2.35 | |||||
| Eligible voters | 73,357 | |||||||
| New Democratic hold | Swing | +5.42 | ||||||
| Sources:[8][9] | ||||||||
| Canadian federal election, 2008 | ||||||||
|---|---|---|---|---|---|---|---|---|
| Party | Candidate | Votes | % | ∆% | Expenditures | |||
| New Democratic | Megan Leslie | 19,252 | 42.69 | -4.19 | $74,406.04 | |||
| Liberal | Catherine Meade | 12,458 | 27.62 | -3.28 | $44,352.90 | |||
| Conservative | Ted Larsen | 9,295 | 20.61 | +2.61 | $57,956.79 | |||
| Green | Darryl Whetter | 3,931 | 8.72 | +4.82 | $1,734.06 | |||
| Marxist–Leninist | Tony Seed | 162 | 0.36 | +0.03 | none listed | |||
| Total valid votes/Expense limit | 45,098 | 100.0 | $81,457 | |||||
| Total rejected, unmarked and declined ballots | 230 | 0.51 | +0.09 | |||||
| Turnout | 45,328 | 60.67 | -4.58 | |||||
| Eligible voters | 74,717 | |||||||
| New Democratic hold | Swing | -0.46 | ||||||
| Canadian federal election, 2006 | ||||||||
|---|---|---|---|---|---|---|---|---|
| Party | Candidate | Votes | % | ∆% | Expenditures | |||
| New Democratic | Alexa McDonough | 23,420 | 46.88 | +5.33 | $67,353.61 | |||
| Liberal | Martin MacKinnon | 15,437 | 30.90 | -8.21 | $62,643.27 | |||
| Conservative | Andrew House | 8,992 | 18.00 | +3.37 | $73,744.64 | |||
| Green | Nick Wright | 1,948 | 3.90 | -0.81 | $861.16 | |||
| Marxist–Leninist | Tony Seed | 164 | 0.33 | – | none listed | |||
| Total valid votes/Expense limit | 49,961 | 100.0 | $77,542 | |||||
| Total rejected, unmarked and declined ballots | 210 | 0.42 | -0.17 | |||||
| Turnout | 50,171 | 65.25 | ||||||
| Eligible voters | 76,885 | |||||||
| New Democratic hold | Swing | +6.77 | ||||||
| Canadian federal election, 2004 | ||||||||
|---|---|---|---|---|---|---|---|---|
| Party | Candidate | Votes | % | ∆% | Expenditures | |||
| New Democratic | Alexa McDonough | 18,341 | 41.55 | -0.01 | $64,636.07 | |||
| Liberal | Sheila Fougere | 17,267 | 39.11 | +7.25 | $61,349.27 | |||
| Conservative | Kevin Keefe | 6,457 | 14.63 | -9.19 | $61,519.35 | |||
| Green | Michael Oddy | 2,081 | 4.71 | none listed | ||||
| Total valid votes/Expense limit | 44,146 | 100.0 | $73,393 | |||||
| Total rejected, unmarked and declined ballots | 260 | 0.59 | ||||||
| Turnout | 44,406 | 62.68 | ||||||
| Eligible voters | 70,847 | |||||||
| New Democratic notional hold | Swing | -2.39 | ||||||
| Changes from 2000 are based on redistributed results. Conservative Party change is based on the combination of Canadian Alliance and Progressive Conservative Party totals. | ||||||||
| 2000 federal election redistributed results | |||
|---|---|---|---|
| Party | Vote | % | |
| New Democratic | 17,548 | 41.56 | |
| Liberal | 13,453 | 31.86 | |
| Progressive Conservative | 7,487 | 17.73 | |
| Alliance | 2,570 | 6.09 | |
| Others | 1,169 | 2.77 | |
Halifax, 1968–2004
| Canadian federal election, 2000 | ||||||||
|---|---|---|---|---|---|---|---|---|
| Party | Candidate | Votes | % | ∆% | ||||
| New Democratic | Alexa McDonough | 16,567 | 40.29 | -8.73 | ||||
| Liberal | Kevin Little | 13,600 | 33.07 | +11.43 | ||||
| Progressive Conservative | Paul Fitzgibbons | 7,279 | 17.70 | -5.56 | ||||
| Alliance | Amery Boyer | 2,346 | 5.71 | +0.27 | ||||
| Marijuana | Mike Patriquen | 627 | 1.52 | |||||
| Green | Michael Oddy | 587 | 1.43 | |||||
| Marxist–Leninist | Kevin Dumont Corkill | 113 | 0.27 | +0.07 | ||||
| Total valid votes | 41,119 | 100.00 | ||||||
Changes for the Canadian Alliance from 1997 are based on the results of its predecessor, the Reform Party.
| Canadian federal election, 1997 | ||||||||
|---|---|---|---|---|---|---|---|---|
| Party | Candidate | Votes | % | ∆% | ||||
| New Democratic | Alexa McDonough | 21,837 | 49.02 | +35.68 | ||||
| Progressive Conservative | Terry Donahoe | 10,361 | 23.26 | +2.58 | ||||
| Liberal | Mary Clancy | 9,638 | 21.64 | -24.27 | ||||
| Reform | Steve Greene | 2,422 | 5.44 | -9.02 | ||||
| Natural Law | Gilles Bigras | 197 | 0.44 | -0.52 | ||||
| Marxist–Leninist | Tony Seed | 89 | 0.20 | +0.02 | ||||
| Total valid votes | 44,544 | 100.00 | ||||||
| Canadian federal election, 1993 | ||||||||
|---|---|---|---|---|---|---|---|---|
| Party | Candidate | Votes | % | ∆% | ||||
| Liberal | Mary Clancy | 21,326 | 45.91 | +2.91 | ||||
| Progressive Conservative | Jim Vaughan | 9,606 | 20.68 | -17.29 | ||||
| Reform | Steve Greene | 6,717 | 14.46 | |||||
| New Democratic | Lynn Jones | 6,197 | 13.34 | -4.40 | ||||
| National | Charles Phillips | 1,385 | 2.98 | |||||
| Natural Law | Gilles Bigras | 448 | 0.96 | |||||
| Green | W. Vladimir Klonowski | 314 | 0.68 | |||||
| Independent | A.R. Art Canning | 277 | 0.60 | |||||
| Independent | Steve Rimek | 99 | 0.21 | |||||
| Marxist–Leninist | Tony Seed | 84 | 0.18 | |||||
| Total valid votes | 46,453 | 100.00 | ||||||
Changes for Marxist–Leninist candidate Tony Seed are based on his 1988 results, when he ran as an Independent.
| Canadian federal election, 1988 | ||||||||
|---|---|---|---|---|---|---|---|---|
| Party | Candidate | Votes | % | ∆% | ||||
| Liberal | Mary Clancy | 22,470 | 43.00 | +8.64 | ||||
| Progressive Conservative | Stewart McInnes | 19,840 | 37.97 | -6.81 | ||||
| New Democratic | Ray Larkin | 9,269 | 17.74 | -2.71 | ||||
| Libertarian | Howard J. MacKinnon | 292 | 0.56 | |||||
| Communist | Miguel Figueroa | 151 | 0.29 | |||||
| Independent | Tony Seed | 134 | 0.26 | |||||
| Commonwealth of Canada | J. Basil MacDougall | 94 | 0.18 | |||||
| Total valid votes | 52,250 | 100.00 | ||||||
| Canadian federal election, 1984 | ||||||||
|---|---|---|---|---|---|---|---|---|
| Party | Candidate | Votes | % | ∆% | ||||
| Progressive Conservative | Stewart McInnes | 18,779 | 44.78 | +6.20 | ||||
| Liberal | Gerald Regan | 14,411 | 34.36 | -7.27 | ||||
| New Democratic | Tessa Hebb | 8,576 | 20.45 | +0.78 | ||||
| Independent | Ignatius Kennedy | 174 | 0.41 | |||||
| Total valid votes | 41,940 | 100.00 | ||||||
| Canadian federal election, 1980 | ||||||||
|---|---|---|---|---|---|---|---|---|
| Party | Candidate | Votes | % | ∆% | ||||
| Liberal | Gerald Regan | 16,949 | 41.63 | +1.21 | ||||
| Progressive Conservative | George Cooper | 15,710 | 38.58 | -1.87 | ||||
| New Democratic | Alexa McDonough | 8,009 | 19.67 | +1.14 | ||||
| Marxist–Leninist | Charles Spurr | 48 | 0.12 | +0.05 | ||||
| Total valid votes | 40,716 | 100.00 | ||||||
| Canadian federal election, 1979 | ||||||||
|---|---|---|---|---|---|---|---|---|
| Party | Candidate | Votes | % | ∆% | ||||
| Progressive Conservative | George Cooper | 16,570 | 40.45 | -8.81 | ||||
| Liberal | Brian Flemming | 16,555 | 40.42 | -0.28 | ||||
| New Democratic | Alexa McDonough | 7,590 | 18.53 | +9.20 | ||||
| Independent | David F. Gray | 155 | 0.38 | |||||
| Communist | D. Scott Milsom | 64 | 0.16 | |||||
| Marxist–Leninist | Tony Seed | 27 | 0.07 | -0.18 | ||||
| Total valid votes | 40,961 | 100.00 | ||||||
| Canadian federal election, 1974 | ||||||||
|---|---|---|---|---|---|---|---|---|
| Party | Candidate | Votes | % | ∆% | ||||
| Progressive Conservative | Robert Stanfield | 14,865 | 49.26 | -6.78 | ||||
| Liberal | Brian Flemming | 12,282 | 40.70 | +9.39 | ||||
| New Democratic | Alasdair M. Sinclair | 2,817 | 9.33 | -2.95 | ||||
| Social Credit | Brian Pitcairn | 140 | 0.46 | |||||
| Marxist–Leninist | Tony Seed | 75 | 0.25 | -0.13 | ||||
| Total valid votes | 30,179 | 100.00 | ||||||
Changes for Marxist–Leninist candidate Tony Seed are based on his results in 1972, when he ran unaffiliated.
| Canadian federal election, 1972 | ||||||||
|---|---|---|---|---|---|---|---|---|
| Party | Candidate | Votes | % | ∆% | ||||
| Progressive Conservative | Robert Stanfield | 17,966 | 56.04 | -4.29 | ||||
| Liberal | Terry McGrath | 10,039 | 31.31 | -4.31 | ||||
| New Democratic | Marty Dolin | 3,936 | 12.28 | +8.23 | ||||
| Independent | Tony Seed | 121 | 0.38 | |||||
| Total valid votes | 32,062 | 100.00 | ||||||
| Canadian federal election, 1968 | ||||||||
|---|---|---|---|---|---|---|---|---|
| Party | Candidate | Votes | % | |||||
| Progressive Conservative | Robert Stanfield | 19,569 | 60.33 | |||||
| Liberal | M. Gregory Tompkins | 11,555 | 35.62 | |||||
| New Democratic | Gus Wedderburn | 1,314 | 4.05 | |||||
| Total valid votes | 32,438 | 100.00 | ||||||
Halifax, 1867–1968 (two members)
| Canadian federal election, 1965 | ||||||||
|---|---|---|---|---|---|---|---|---|
| Party | Candidate | Votes | % | Elected | ||||
| Progressive Conservative | Robert McCleave | 46,007 | 25.08 | |||||
| Progressive Conservative | Michael Forrestall | 40,983 | 22.34 | |||||
| Liberal | John Lloyd | 39,942 | 21.77 | |||||
| Liberal | Robert J. Butler | 38,191 | 20.82 | |||||
| New Democratic | Jim Aitchison | 8,983 | 4.90 | |||||
| New Democratic | Bruce Wallace | 8,387 | 4.57 | |||||
| Independent | Ignatius Jeriome Kennedy | 950 | 0.52 | |||||
| Total valid votes | 183,443 | 100.00 | ||||||
| Canadian federal election, 1963 | ||||||||
|---|---|---|---|---|---|---|---|---|
| Party | Candidate | Votes | % | Elected | ||||
| Liberal | John Lloyd | 46,274 | 25.29 | |||||
| Liberal | Gerald Regan | 45,173 | 24.69 | |||||
| Progressive Conservative | Robert McCleave | 42,548 | 23.25 | |||||
| Progressive Conservative | Finlay Macdonald | 41,655 | 22.77 | |||||
| New Democratic | Allan O'Brien | 3,860 | 2.11 | |||||
| New Democratic | Perry Ronayne | 3,466 | 1.89 | |||||
| Total valid votes | 182,976 | 100.00 | ||||||
| Canadian federal election, 1962 | ||||||||
|---|---|---|---|---|---|---|---|---|
| Party | Candidate | Votes | % | Elected | ||||
| Progressive Conservative | Robert McCleave | 42,964 | 23.77 | |||||
| Progressive Conservative | Edmund L. Morris | 41,804 | 23.12 | |||||
| Liberal | John Lloyd | 41,472 | 22.94 | |||||
| Liberal | Gerald A. Regan | 40,635 | 22.48 | |||||
| New Democratic | James H. Aitchison | 6,464 | 3.58 | |||||
| New Democratic | Perry Ronayne | 5,653 | 3.13 | |||||
| Social Credit | Robert J. Kuglin | 1,784 | 0.99 | |||||
| Total valid votes | 180,776 | 100.00 | ||||||
| Canadian federal election, 1958 | ||||||||
|---|---|---|---|---|---|---|---|---|
| Party | Candidate | Votes | % | Elected | ||||
| Progressive Conservative | Robert McCleave | 53,693 | 30.05 | |||||
| Progressive Conservative | Edmund L. Morris | 53,255 | 29.80 | |||||
| Liberal | John Horace Dickey | 34,227 | 19.15 | |||||
| Liberal | Leonard Kitz | 32,916 | 18.42 | |||||
| Co-operative Commonwealth | Hyacinth Lawrence MacIntosh | 2,552 | 1.43 | |||||
| Co-operative Commonwealth | Lloyd Carman Wilson | 2,048 | 1.15 | |||||
| Total valid votes | 178,691 | 100.00 | ||||||
| Canadian federal election, 1957 | ||||||||
|---|---|---|---|---|---|---|---|---|
| Party | Candidate | Votes | % | Elected | ||||
| Progressive Conservative | Robert McCleave | 41,140 | 25.32 | |||||
| Progressive Conservative | Edmund L. Morris | 41,099 | 25.29 | |||||
| Liberal | Samuel Rosborough Balcom | 38,504 | 23.70 | |||||
| Liberal | John Horace Dickey | 38,191 | 23.51 | |||||
| Co-operative Commonwealth | Hyacinth Lawrence MacIntosh | 1,984 | 1.22 | |||||
| Co-operative Commonwealth | Lloyd Carman Wilson | 1,562 | 0.96 | |||||
| Total valid votes | 162,480 | 100.00 | ||||||
| Canadian federal election, 1953 | ||||||||
|---|---|---|---|---|---|---|---|---|
| Party | Candidate | Votes | % | Elected | ||||
| Liberal | John Horace Dickey | 34,587 | 27.82 | |||||
| Liberal | Samuel Rosborough Balcom | 34,222 | 27.53 | |||||
| Progressive Conservative | Edmund L. Morris | 26,552 | 21.36 | |||||
| Progressive Conservative | Frederick William Bissett | 24,112 | 19.39 | |||||
| Co-operative Commonwealth | Hyacinth Lawrence MacIntosh | 2,731 | 2.20 | |||||
| Co-operative Commonwealth | Lloyd Carman Wilson | 2,120 | 1.71 | |||||
| Total valid votes | 124,324 | 100.00 | ||||||
| Canadian federal by-election, 19 June 1950 | ||||||||
|---|---|---|---|---|---|---|---|---|
| Party | Candidate | Votes | % | Elected | ||||
| Liberal | Samuel Rosborough Balcom | 24,665 | 57.07 | |||||
| Progressive Conservative | Lloyd Allen | 13,696 | 31.69 | |||||
| Co-operative Commonwealth | J.W.A. Nicholson | 4,861 | 11.25 | |||||
| Total valid votes | 43,222 | 100.00 | ||||||
| Called upon Gordon Isnor being called to the Senate, 2 May 1950 | ||||||||
| Canadian federal election, 1949 | ||||||||
|---|---|---|---|---|---|---|---|---|
| Party | Candidate | Votes | % | Elected | ||||
| Liberal | Gordon Benjamin Isnor | 33,401 | 29.33 | |||||
| Liberal | John Horace Dickey | 31,627 | 27.77 | |||||
| Progressive Conservative | Joseph Patrick Connolly | 18,826 | 16.53 | |||||
| Progressive Conservative | Frederick William Bissett | 18,223 | 16.00 | |||||
| Co-operative Commonwealth | Hyacinth Lawrence MacIntosh | 6,018 | 5.28 | |||||
| Co-operative Commonwealth | Lloyd R. Shaw | 5,777 | 5.07 | |||||
| Total valid votes | 113,872 | 100.00 | ||||||
| Canadian federal by-election, 14 July 1947 | ||||||||
|---|---|---|---|---|---|---|---|---|
| Party | Candidate | Votes | % | Elected | ||||
| Liberal | John Horace Dickey | 24,469 | 44.99 | |||||
| Co-operative Commonwealth | Hyacinth Lawrence MacIntosh | 16,151 | 29.70 | |||||
| Progressive Conservative | Alex A. McDonald | 13,768 | 25.31 | |||||
| Total valid votes | 54,388 | 100.00 | ||||||
| Canadian federal election, 1945 | ||||||||
|---|---|---|---|---|---|---|---|---|
| Party | Candidate | Votes | % | Elected | ||||
| Liberal | Gordon Benjamin Isnor | 26,407 | 25.15 | |||||
| Liberal | William Chisholm MacDonald | 23,616 | 22.49 | |||||
| Progressive Conservative | Henry P. MacKeen | 18,182 | 17.31 | |||||
| Progressive Conservative | Gerald Dwyer | 18,037 | 17.18 | |||||
| Co-operative Commonwealth | Lloyd R. Shaw | 8,937 | 8.51 | |||||
| Co-operative Commonwealth | R. Leo Rooney | 8,783 | 8.36 | |||||
| Labor–Progressive | R. Charles Murray | 560 | 0.53 | |||||
| Independent | O.R. Regan | 488 | 0.46 | |||||
| Total valid votes | 105,010 | 100.00 | ||||||
| Canadian federal election, 1940 | ||||||||
|---|---|---|---|---|---|---|---|---|
| Party | Candidate | Votes | % | Elected | ||||
| Liberal | William Chisholm MacDonald | 22,089 | 24.94 | |||||
| Liberal | Gordon Benjamin Isnor | 19,398 | 21.90 | |||||
| National Government | Richard A. Donahoe | 18,197 | 20.54 | |||||
| National Government | Charles B. Smith | 18,114 | 20.45 | |||||
| Independent Liberal | Robert Emmett Finn | 9,217 | 10.41 | |||||
| Co-operative Commonwealth | Helgi I.S. Borgford | 1,561 | 1.76 | |||||
| Total valid votes | 88,576 | 100.00 | ||||||
| Canadian federal election, 1935 | ||||||||
|---|---|---|---|---|---|---|---|---|
| Party | Candidate | Votes | % | Elected | ||||
| Liberal | Gordon Benjamin Isnor | 24,158 | 28.18 | |||||
| Liberal | Robert Emmett Finn | 23,312 | 27.19 | |||||
| Conservative | Robert D. Guilford | 13,624 | 15.89 | |||||
| Conservative | Louis A. Gastonguay | 13,250 | 15.45 | |||||
| Reconstruction | John Furlong | 6,307 | 7.36 | |||||
| Reconstruction | John Joseph Power | 5,091 | 5.94 | |||||
| Total valid votes | 85,742 | 100.00 | ||||||
| Canadian federal election, 1930 | ||||||||
|---|---|---|---|---|---|---|---|---|
| Party | Candidate | Votes | % | Elected | ||||
| Conservative | William Anderson Black | 21,611 | 26.51 | |||||
| Conservative | Felix Patrick Quinn | 21,280 | 26.11 | |||||
| Liberal | Peter R. Jack | 19,439 | 23.85 | |||||
| Liberal | Edward Joseph Cragg | 19,185 | 23.54 | |||||
| Total valid votes | 81,515 | 100.00 | ||||||
| Canadian federal election, 1926 | ||||||||
|---|---|---|---|---|---|---|---|---|
| Party | Candidate | Votes | % | Elected | ||||
| Conservative | William Anderson Black | 17,911 | 28.33 | |||||
| Conservative | Felix Patrick Quinn | 17,171 | 27.16 | |||||
| Liberal | James Layton Ralston | 14,139 | 22.36 | |||||
| Liberal | John Murphy | 14,007 | 22.15 | |||||
| Total valid votes | 63,228 | 100.00 | ||||||
| Canadian federal election, 1925 | ||||||||
|---|---|---|---|---|---|---|---|---|
| Party | Candidate | Votes | % | Elected | ||||
| Conservative | William Anderson Black | 18,796 | 32.29 | |||||
| Conservative | Felix Patrick Quinn | 17,996 | 30.91 | |||||
| Liberal | Gordon Ross Marshall | 10,815 | 18.58 | |||||
| Liberal | Robert Emmett Finn | 10,609 | 18.22 | |||||
| Total valid votes | 58,216 | 100.00 | ||||||
| Canadian federal by-election, 5 December 1923 | ||||||||
|---|---|---|---|---|---|---|---|---|
| Party | Candidate | Votes | % | Elected | ||||
| Conservative | William Anderson Black | 13,365 | 53.90 | |||||
| Liberal | George Alfred Redmond | 11,433 | 46.10 | |||||
| Total valid votes | 24,798 | 100.00 | ||||||
| Called upon Alexander Maclean's acceptance of an office of emolument under the Crown, 2 November 1923 | ||||||||
| Canadian federal by-election, 4 December 1922 | ||||||||
|---|---|---|---|---|---|---|---|---|
| Party | Candidate | Votes | % | Elected | ||||
| Liberal | Robert Emmett Finn | 8,668 | 54.61 | |||||
| Conservative | John Joseph Power | 4,796 | 30.21 | |||||
| Labour | James Joseph O'Connell | 2,409 | 15.18 | |||||
| Total valid votes | 15,873 | 100.00 | ||||||
| Called upon Edward Blackadder's death, 22 October 1922 | ||||||||
| Canadian federal election, 1921 | ||||||||
|---|---|---|---|---|---|---|---|---|
| Party | Candidate | Votes | % | Elected | ||||
| Liberal | Edward Blackadder | 16,157 | 26.70 | |||||
| Liberal | Alexander Kenneth Maclean | 15,892 | 26.27 | |||||
| Conservative | Hector McInnes | 11,016 | 18.21 | |||||
| Conservative | James Wilfred Doyle | 9,537 | 15.76 | |||||
| Labour | Arthur Charles Hawkins | 4,141 | 6.84 | |||||
| Labour | Joseph Sylvester Wallace | 3,763 | 6.22 | |||||
| Total valid votes | 60,506 | 100.00 | ||||||
| Canadian federal election, 1917 | ||||||||
|---|---|---|---|---|---|---|---|---|
| Party | Candidate | Votes | Elected | |||||
| Government (Unionist) | Alexander Kenneth Maclean | acclaimed | ||||||
| Government (Unionist) | Peter Francis Martin | acclaimed | ||||||
| Canadian federal by-election, 27 October 1911 | ||||||||
|---|---|---|---|---|---|---|---|---|
| Party | Candidate | Votes | Elected | |||||
| Conservative | Robert Borden | acclaimed | ||||||
| Called upon the appointment of Robert Borden's as President of the King's Privy Council for Canada and his becoming Prime Minister of Canada, 10 October 1911 | ||||||||
| Canadian federal election, 1911 | ||||||||
|---|---|---|---|---|---|---|---|---|
| Party | Candidate | Votes | % | Elected | ||||
| Conservative | Robert Borden | 7,040 | 25.46 | |||||
| Liberal | Alexander Kenneth Maclean | 6,946 | 25.12 | |||||
| Liberal | Edward Blackadder | 6,879 | 24.88 | |||||
| Conservative | Adam Brown Crosby | 6,787 | 24.54 | |||||
| Total valid votes | 27,652 | 100.00 | ||||||
| Canadian federal election, 1908 | ||||||||
|---|---|---|---|---|---|---|---|---|
| Party | Candidate | Votes | % | Elected | ||||
| Conservative | Robert Borden | 7,386 | 26.80 | |||||
| Conservative | Adam Brown Crosby | 7,115 | 25.82 | |||||
| Liberal | William Roche | 6,635 | 24.08 | |||||
| Liberal | Michael Carney | 6,423 | 23.31 | |||||
| Total valid votes | 27,559 | 100.00 | ||||||
| Canadian federal election, 1904 | ||||||||
|---|---|---|---|---|---|---|---|---|
| Party | Candidate | Votes | % | Elected | ||||
| Liberal | William Roche | 7,430 | 26.53 | |||||
| Liberal | Michael Carney | 7,277 | 25.98 | |||||
| Conservative | Robert Borden | 6,830 | 24.39 | |||||
| Conservative | John C. O'Mullin | 6,472 | 23.11 | |||||
| Total valid votes | 28,009 | 100.00 | ||||||
| Canadian federal election, 1900 | ||||||||
|---|---|---|---|---|---|---|---|---|
| Party | Candidate | Votes | % | Elected | ||||
| Conservative | Robert Borden | 5,705 | 25.67 | |||||
| Liberal | William Roche | 5,577 | 25.09 | |||||
| Conservative | Thomas Edward Kenny | 5,562 | 25.03 | |||||
| Liberal | William B. Wallace | 5,380 | 24.21 | |||||
| Total valid votes | 22,224 | 100.00 | ||||||
| Canadian federal election, 1896 | ||||||||
|---|---|---|---|---|---|---|---|---|
| Party | Candidate | Votes | % | Elected | ||||
| Conservative | Robert Borden | 6,170 | 26.53 | |||||
| Liberal | Benjamin Russell | 5,997 | 25.79 | |||||
| Conservative | Thomas Edward Kenny | 5,616 | 24.15 | |||||
| Liberal | M.E. Keefe | 5,472 | 23.53 | |||||
| Total valid votes | 23,255 | 100.00 | ||||||
| Canadian federal by-election, 11 February 1892 | ||||||||
|---|---|---|---|---|---|---|---|---|
| Party | Candidate | Votes | Elected | |||||
| Conservative | Thomas Edward Kenny | acclaimed | ||||||
| Conservative | John Fitzwilliam Stairs | acclaimed | ||||||
| Called upon election being declared void | ||||||||
| Canadian federal election, 1891 | ||||||||
|---|---|---|---|---|---|---|---|---|
| Party | Candidate | Votes | % | Elected | ||||
| Conservative | Thomas Edward Kenny | 5,274 | 27.69 | |||||
| Conservative | John Fitzwilliam Stairs | 5,262 | 27.63 | |||||
| Liberal | Alfred Gilpin Jones | 4,335 | 22.76 | |||||
| Liberal | Edward Farrell | 4,174 | 21.92 | |||||
| Total valid votes | 19,045 | 100.00 | ||||||
| Canadian federal election, 1887 | ||||||||
|---|---|---|---|---|---|---|---|---|
| Party | Candidate | Votes | % | Elected | ||||
| Liberal | Alfred Gilpin Jones | 4,243 | 25.53 | |||||
| Conservative | Thomas Edward Kenny | 4,181 | 25.15 | |||||
| Conservative | John Fitzwilliam Stairs | 4,099 | 24.66 | |||||
| Liberal | H.H. Fuller | 4,098 | 24.66 | |||||
| Total valid votes | 16,621 | 100.00 | ||||||
| Canadian federal by-election, 25 July 1883 | ||||||||
|---|---|---|---|---|---|---|---|---|
| Party | Candidate | Votes | Elected | |||||
| Conservative | John Fitzwilliam Stairs | acclaimed | ||||||
| Called upon Matthew Richey being named Lieutenant Governor of Nova Scotia, 4 July 1883 | ||||||||
| Canadian federal election, 1882 | ||||||||
|---|---|---|---|---|---|---|---|---|
| Party | Candidate | Votes | % | Elected | ||||
| Liberal–Conservative | M.B. Daly | 2,811 | 25.84 | |||||
| Liberal–Conservative | Matthew Henry Richey | 2,785 | 25.60 | |||||
| Independent | Alfred Gilpin Jones | 2,720 | 25.00 | |||||
| Liberal | H.H. Fuller | 2,563 | 23.56 | |||||
| Total valid votes | 10,879 | 100.00 | ||||||
| Canadian federal election, 1878 | ||||||||
|---|---|---|---|---|---|---|---|---|
| Party | Candidate | Votes | % | Elected | ||||
| Liberal–Conservative | Matthew Henry Richey | 3,532 | 28.13 | |||||
| Liberal–Conservative | M.B. Daly | 3,466 | 27.60 | |||||
| Independent | Alfred Gilpin Jones | 2,863 | 22.80 | |||||
| Independent Liberal | Patrick Power | 2,695 | 21.46 | |||||
| Total valid votes | 12,556 | 100.00 | ||||||
| Canadian federal by-election, 29 January 1878 | ||||||||
|---|---|---|---|---|---|---|---|---|
| Party | Candidate | Votes | % | Elected | ||||
| Independent | Alfred Gilpin Jones | 2,981 | 51.92 | |||||
| Unknown | Matthew Henry Richey | 2,761 | 48.08 | |||||
| Total valid votes | 5,742 | 100.00 | ||||||
| Called upon the resignation of Alfred Jones because of an alleged breach of the Independence of Parliament Act | ||||||||
| Canadian federal election, 1874 | ||||||||
|---|---|---|---|---|---|---|---|---|
| Party | Candidate | Votes | % | Elected | ||||
| Independent Liberal | Patrick Power | 3,186 | 45.52 | |||||
| Independent | Alfred Gilpin Jones | 2,979 | 42.56 | |||||
| Unknown | G. Robb | 834 | 11.92 | |||||
| Total valid votes | 6,999 | 100.00 | ||||||
| Canadian federal election, 1872 | ||||||||
|---|---|---|---|---|---|---|---|---|
| Party | Candidate | Votes | % | Elected | ||||
| Liberal–Conservative | William Johnston Almon | 2,528 | 25.55 | |||||
| Liberal | Stephen Tobin | 2,486 | 25.12 | |||||
| Independent Liberal | Patrick Power | 2,452 | 24.78 | |||||
| Independent | Alfred Gilpin Jones | 2,430 | 24.56 | |||||
| Total valid votes | 9,896 | 100.00 | ||||||
| Canadian federal election, 1867 | ||||||||
|---|---|---|---|---|---|---|---|---|
| Party | Candidate | Votes | % | Elected | ||||
| Anti-Confederation | Alfred Gilpin Jones | 2,381 | 26.28 | |||||
| Anti-Confederation | Patrick Power | 2,367 | 26.13 | |||||
| Unknown | John Tobin | 2,158 | 23.82 | |||||
| Unknown | S.L. Shannon | 2,154 | 23.77 | |||||
| Total valid votes | 9,060 | 100.00 | ||||||
See also
References
- "(Code 12004) Census Profile". 2011 census. Statistics Canada. 2012. Retrieved 2011-03-03.
Notes
- 1 2 Statistics Canada: 2011
- ↑ "Halifax MP Alexa McDonough announces retirement". CBC News. 2 June 2008. Retrieved 2008-06-02.
- ↑ http://www12.statcan.gc.ca/nhs-enm/2011/dp-pd/prof/details/page.cfm?Lang=E&Geo1=FED2013&Code1=12005&Data=Count&SearchText=Halifax&SearchType=Begins&SearchPR=01&A1=All&B1=All&Custom=&TABID=1
- ↑ http://www12.statcan.gc.ca/nhs-enm/2011/dp-pd/prof/details/page.cfm?Lang=E&Geo1=FED2013&Code1=12005&Data=Count&SearchText=Halifax&SearchType=Begins&SearchPR=01&A1=All&B1=All&Custom=&TABID=1#tabs2
- ↑ "October 19, 2015 Election Results — Halifax (Validated results)". Elections Canada. 22 October 2015. Retrieved 24 October 2015.
- ↑ Elections Canada – Preliminary Election Expenses Limits for Candidates
- ↑ Pundits' Guide to Canadian Elections
- ↑ Elections Canada – Official voting results, Forty-first general election, 2011
- ↑ Elections Canada – Candidate's electoral campaign return, 41st general election
External links
| Parliament of Canada | ||
|---|---|---|
| Preceded by Quebec East |
Constituency represented by the Prime Minister 1911-1917 |
Succeeded by Kings |