Redbridge London Borough Council elections

Redbridge London Borough Council (in northeast London, England) is elected every four years.
Political control
Since the first election to the council in 1964 political control of the council has been held by the following parties:
| Party in control | Years |
|---|---|
| Conservative | 1964–1994 |
| No overall control | 1994-2002 |
| Conservative | 2002-2009 |
| No overall control | 2009–2014 |
| Labour | 2014–present |
Council elections
- Redbridge London Borough Council election, 1964
- Redbridge London Borough Council election, 1968
- Redbridge London Borough Council election, 1971
- Redbridge London Borough Council election, 1974
- Redbridge London Borough Council election, 1978 (boundary changes increased the number of seats by three)[1]
- Redbridge London Borough Council election, 1982
- Redbridge London Borough Council election, 1986
- Redbridge London Borough Council election, 1990
- Redbridge London Borough Council election, 1994 (boundary changes reduced the number of seats by one)[2][n 1][n 2]
- Redbridge London Borough Council election, 1998 (boundary changes took place but the number of seats remained the same)[n 3][n 4]
- Redbridge London Borough Council election, 2002 (boundary changes increased the number of seats by one)[3]
- Redbridge London Borough Council election, 2006
- Redbridge London Borough Council election, 2010
- Redbridge London Borough Council election, 2014
Borough result maps
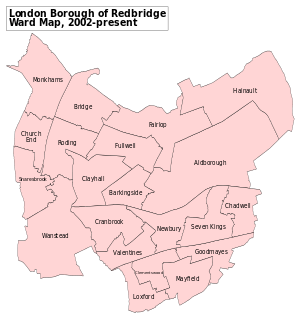
 2002 results map
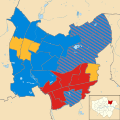
 2006 results map
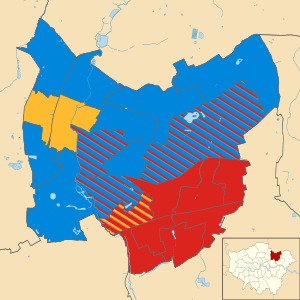
 2010 results map
 2014 results map
By-election results
1964-1968
There were no by-elections.[4]
1968-1971
| Party | Candidate | Votes | % | ± | |
|---|---|---|---|---|---|
| Conservative | C. F. Annal | 1646 | |||
| Labour | R. M. Spack | 550 | |||
| Liberal | T. J. Needham | 386 | |||
| National Front | W. J. Partridge | 81 | |||
| Communist | Mrs E. M. Woddis | 58 | |||
| Turnout | 31.2% | ||||
| Party | Candidate | Votes | % | ± | |
|---|---|---|---|---|---|
| Labour | T. R. Reynolds | 1807 | |||
| Conservative | B. H. Gunby | 738 | |||
| Liberal | J. P. Stonham | 123 | |||
| National Front | R. W. Tear | 102 | |||
| Turnout | 31.5% | ||||
1971-1974
| Party | Candidate | Votes | % | ± | |
|---|---|---|---|---|---|
| Conservative | B. W. Tarring | 1,609 | |||
| Labour | Mrs T. H. Desmond | 660 | |||
| Liberal | Mrs M. J. Hoskins | 433 | |||
| Turnout | 24.6% | ||||
| Party | Candidate | Votes | % | ± | |
|---|---|---|---|---|---|
| Labour | W. Finesilver | 1,939 | |||
| Liberal | E. G. Flack | 813 | |||
| Conservative | J. R. Lovell | 523 | |||
| Turnout | 31.0% | ||||
1974-1978
| Party | Candidate | Votes | % | ± | |
|---|---|---|---|---|---|
| Conservative | Regina Ashton | 1,590 | |||
| Liberal | Richard H. Hoskins | 968 | |||
| Labour | Philip Phillips | 414 | |||
| Turnout | 30.6 | ||||
| Party | Candidate | Votes | % | ± | |
|---|---|---|---|---|---|
| Conservative | Peter R. Goody | 1,703 | |||
| Liberal | Richard H. Hoskins | 984 | |||
| Labour | David J. Rose | 310 | |||
| Turnout | 29.0 | ||||
| Party | Candidate | Votes | % | ± | |
|---|---|---|---|---|---|
| Conservative | Leslie G. Bridgeman | 2,413 | |||
| Liberal | Sidney A. Cohen | 450 | |||
| Labour | Gwyneth Phillips | 284 | |||
| Turnout | 23.7 | ||||
| Party | Candidate | Votes | % | ± | |
|---|---|---|---|---|---|
| Conservative | Carole S. Maddock | 2,597 | |||
| Labour | Charles E. G. Burgess | 1,491 | |||
| Liberal | Gareth L. P. Wilson | 324 | |||
| Turnout | 42.9 | ||||
| Party | Candidate | Votes | % | ± | |
|---|---|---|---|---|---|
| Conservative | John C. Allan | 1,892 | |||
| Liberal | Alan F. Cornish | 1,166 | |||
| Labour | Gwyneth Phillips | 424 | |||
| Turnout | 29.2 | ||||
| Party | Candidate | Votes | % | ± | |
|---|---|---|---|---|---|
| Conservative | Michael G. Kirrage | 2,116 | |||
| Labour | Raymond D. Smith | 835 | |||
| National Front | John R. Hughes | 176 | |||
| Liberal | Peter W. Briggs | 155 | |||
| Turnout | 30.2 | ||||
1990-1994
| Party | Candidate | Votes | % | ± | |
|---|---|---|---|---|---|
| Conservative | Keith R. Langford | 1,122 | 36.5 | ||
| Labour | Joseph B. Hoedemaker | 1,098 | 35.8 | ||
| Liberal Democrat | George G. Hogarth | 851 | 27.7 | ||
| Turnout | 40.2 | ||||
| Conservative hold | Swing | ||||
The by-election was called following the death of Cllr. Arnold Kinzley.
| Party | Candidate | Votes | % | ± | |
|---|---|---|---|---|---|
| Conservative | Michael J. Stark | 1,407 | 52.3 | ||
| Liberal Democrat | Michael McElarney | 926 | 34.4 | ||
| Labour | Philip J. Pollard | 357 | 13.3 | ||
| Turnout | 34.8 | ||||
| Conservative hold | Swing | ||||
The by-election was called following the death of Cllr. Nancy H. Thurgood.
1994-1998
| Party | Candidate | Votes | % | ± | |
|---|---|---|---|---|---|
| Labour | John P. Coombes | 1,155 | |||
| Conservative | Graham F. Borratt | 1,078 | |||
| Liberal Democrat | John C. Tyne | 255 | |||
| Turnout | |||||
| Labour hold | Swing | ||||
The by-election was called following the resignation of Cllr. Raymond A. Ward.
| Party | Candidate | Votes | % | ± | |
|---|---|---|---|---|---|
| Labour | Greer C. Nicholson | 1,673 | 55.1 | ||
| Conservative | Harold W. Moth | 1,174 | 38.7 | ||
| Liberal Democrat | Susanne Newman | 188 | 6.2 | ||
| Majority | 499 | 16.4 | |||
| Turnout | 3,035 | 36.0 | |||
| Labour hold | Swing | ||||
The by-election was called following the death of Cllr. Brian R. Myers.
| Party | Candidate | Votes | % | ± | |
|---|---|---|---|---|---|
| Conservative | Graham F. Borrott | 1,549 | 47.7 | ||
| Labour | Robert C. Littlewood | 1,525 | 46.9 | ||
| Liberal Democrat | Albert Williamson | 176 | 5.4 | ||
| Majority | 24 | 0.8 | |||
| Turnout | 3,250 | 33.6 | |||
| Conservative hold | Swing | ||||
The by-election was called following the death of Cllr. Thomas F. Cobb.
| Party | Candidate | Votes | % | ± | |
|---|---|---|---|---|---|
| Labour | Robert C. Littlewood | 1,498 | 61.8 | ||
| Conservative | Munawar H. Shah | 822 | 33.9 | ||
| Liberal Democrat | Narendra Dattani | 102 | 4.2 | ||
| Majority | 676 | 28.1 | |||
| Turnout | 2,422 | 30.7 | |||
| Labour hold | Swing | ||||
The by-election was called following the resignation of Cllr. David A. Masters.
| Party | Candidate | Votes | % | ± | |
|---|---|---|---|---|---|
| Labour | Richard W. Newcombe | 1,054 | 64.5 | +7.5 | |
| Conservative | Lee Scott | 513 | 31.4 | +3.6 | |
| Liberal Democrat | Kathleen M. Black | 67 | 4.1 | -11.1 | |
| Majority | 541 | 33.1 | |||
| Turnout | 1,634 | 23.4 | |||
| Labour hold | Swing | ||||
The by-election was called following the resignation of Cllr. Linda Perham.
1998-2002
| Party | Candidate | Votes | % | ± | |
|---|---|---|---|---|---|
| Conservative | Vanessa Cole | 1,013 | 48.7 | +12.7 | |
| Labour | Gary D. Scottow | 942 | 45.3 | -11.1 | |
| Liberal Democrat | Catherine M. Davies | 125 | 6.0 | -1.6 | |
| Majority | 71 | 3.4 | |||
| Turnout | 2,080 | 30.8 | |||
| Conservative gain from Labour | Swing | ||||
The by-election was called following the resignation of Cllr. Desmond M. Thurlby.
2002-2006
| Party | Candidate | Votes | % | ± | |
|---|---|---|---|---|---|
| Labour | Dev R. Sharma | 1,356 | 47.2 | -5.9 | |
| Conservative | Surenda Patel | 1,313 | 45.7 | +12.1 | |
| Christian Peoples | Juliet Hawkins | 206 | 7.2 | +7.2 | |
| Majority | 43 | 1.5 | |||
| Turnout | 2,875 | 30.0 | |||
| Labour hold | Swing | ||||
The by-election was called following the disqualification of Cllr. Dev R. Sharma.
| Party | Candidate | Votes | % | ± | |
|---|---|---|---|---|---|
| Conservative | Keith A. Prince | 1,468 | 49.0 | -5.0 | |
| Labour | Taifur Rashid | 985 | 32.8 | -1.9 | |
| Liberal Democrat | Matthew Lake | 341 | 11.3 | -0.1 | |
| BNP | Julian Leppert | 116 | 3.9 | +3.9 | |
| Christian Peoples | James Hargreaves | 56 | 1.9 | +1.9 | |
| Independent | Martin Levin | 39 | 1.3 | +1.3 | |
| Majority | 483 | 16.2 | |||
| Turnout | 3,005 | 35.2 | |||
| Conservative hold | Swing | ||||
The by-election was called following the death of Cllr. Keith E. Axon.
| Party | Candidate | Votes | % | ± | |
|---|---|---|---|---|---|
| Conservative | Suresh Kumar | 1,006 | 37.5 | +4.9 | |
| Labour | Lesley R. Hilton | 997 | 37.2 | -4.0 | |
| Liberal Democrat | George G. Hogarth | 422 | 15.7 | +0.2 | |
| Christian Peoples | Juliet F. Hawkins | 170 | 6.3 | +6.3 | |
| Green | Ashley Gunstock | 86 | 3.2 | -7.5 | |
| Majority | 9 | 0.3 | |||
| Turnout | 2,681 | 29.6 | |||
| Conservative gain from Labour | Swing | ||||
The by-election was called following the death of Cllr. Gary D. Scottow.
2006-2010
| Party | Candidate | Votes | % | ± | |
|---|---|---|---|---|---|
| Conservative | Geoffrey D. Hinds | 1,014 | 39.6 | -13.1 | |
| BNP | Daniel Warville | 857 | 33.4 | +33.4 | |
| Labour | Mark A. Epstein | 299 | 11.7 | -7.2 | |
| Liberal Democrat | Angela E. Yeoman | 245 | 9.6 | -5.9 | |
| Green | David I. Reynolds | 147 | 5.7 | -7.1 | |
| Majority | 157 | 6.2 | |||
| Turnout | 2,562 | 30.3 | |||
| Conservative hold | Swing | ||||
The by-election was called following the death of Cllr. James Leal.
| Party | Candidate | Votes | % | ± | |
|---|---|---|---|---|---|
| Liberal Democrat | Irfan Mustafa | 904 | 41.9 | +30.3 | |
| Labour | Mark A. Santos | 715 | 33.1 | -20.6 | |
| Conservative | Dennis J. Aylen | 377 | 17.5 | -0.5 | |
| Independent | Ben T. Brown | 65 | 3.0 | +3.0 | |
| Green | Timothy S. Randall | 49 | 2.2 | ||
| British Public Party | Kashif Rana | 48 | 2.2 | -9.7 | |
| Majority | 189 | ||||
| Turnout | 25.1 | ||||
| Liberal Democrat gain from Labour | Swing | ||||
The by-election was called following the death of Cllr. Simon Green.
| Party | Candidate | Votes | % | ± | |
|---|---|---|---|---|---|
| Conservative | Matthew Chaudhary | 1,625 | 60.0 | +7.7 | |
| Labour | Barbara White | 729 | 27.0 | -4.5 | |
| Liberal Democrat | Helen A. Duffett | 318 | 11.7 | -4.5 | |
| BNP | Anthony Young | 37 | 1.3 | +1.3 | |
| Majority | 896 | 33.0 | |||
| Turnout | 2,709 | 30.0 | |||
| Conservative hold | Swing | ||||
The by-election was called following the death of Cllr. Charles Elliman.
| Party | Candidate | Votes | % | ± | |
|---|---|---|---|---|---|
| Liberal Democrat | Shoaib Patel | 963 | 36.9 | +20.1 | |
| Conservative | Ikram Wahid | 781 | 29.9 | +10.4 | |
| Labour | Surinder Pahl | 756 | 28.9 | -0.3 | |
| Respect | Abdurahman Jafar | 112 | 4.3 | +4.3 | |
| Majority | 182 | ||||
| Turnout | 29.7 | ||||
| Liberal Democrat gain from Labour | Swing | ||||
The by-election was called following the resignation of Cllr. Nadia J. Sharif.
| Party | Candidate | Votes | % | ± | |
|---|---|---|---|---|---|
| Conservative | Alex Wilson | 1300 | |||
| Liberal Democrat | Ms. Kate Garrett | 1030 | |||
| Labour | Ross J. Hatfull | 694 | |||
| Green | Ashley Gunstock | 256 | |||
| BNP | Alfred Evans John | 171 | |||
| UKIP | Nick Jones | 33 | |||
| Turnout | |||||
| Conservative hold | Swing | ||||
The by-election was called following the death of Cllr. Allan C. Burgess.
2010-2014
| Party | Candidate | Votes | % | ± | |
|---|---|---|---|---|---|
| Labour | Wes Streeting | 800 | 31.5 | ||
| Conservative | Gary Ian Munro | 580 | 22.9 | ||
| Liberal Democrat | John Charles Tyne | 576 | 22.7 | ||
| Green | Wilson Chowdhry | 413 | 16.3 | ||
| BNP | Julian Peter Leppert | 115 | 4.5 | ||
| UKIP | Paul Kevin Wiffen | 54 | 2.1 | ||
| Majority | 220 | 8.6 | |||
| Turnout | 2,542 | 25.5 | |||
| Labour hold | Swing | ||||
The by-election was called following the disqualification of Cllr. Mark Gittens.
| Party | Candidate | Votes | % | ± | |
|---|---|---|---|---|---|
| Labour | Debbie Thiara | 1,436 | |||
| Conservative | Melvyn Marks | 1,071 | |||
| Liberal Democrat | Christopher Greaves | 87 | |||
| UKIP | Paul Wiffen | 83 | |||
| Green | Clive Durdle | 64 | |||
| BNP | Danny Warville | 34 | 1.2 | ||
| Majority | 365 | ||||
| Turnout | 2,780 | 24.69 | |||
| Labour hold | Swing | ||||
The by-election was called following the resignation of Cllr. Mike Figg.
2014-2018
| Party | Candidate | Votes | % | ± | |
|---|---|---|---|---|---|
| Labour | Lloyd Jacob Duddridge | 1,832 | 40.9 | +17.5 | |
| Conservative | Ruth Kim Clark | 1,254 | 28.0 | +2.8 | |
| Liberal Democrat | Richard Clare | 983 | 22.0 | -6.3 | |
| UKIP | Jonathon Emmanuel Seymour | 216 | 4.8 | -9.6 | |
| Green | Barry Cooper | 169 | 3.8 | -4.8 | |
| All People's Party | Marilyn Moore | 22 | 0.5 | +0.5 | |
| Majority | 578 | ||||
| Turnout | 4,515 | 52.4% | +11.8 | ||
| Labour gain from Conservative | Swing | ||||
The by-election was triggered by the resignation of Councillor Sarah Blaber (Conservative).
References
- 1 2 3 4 5 6 7 "London Borough Council Elections 4 May 1978" (PDF). London Datastore. Greater London Council. Retrieved 25 February 2015.
- ↑ "London Borough Council Elections 5 May 1994 including Results from the European Elections" (PDF). London Datastore. London Research Centre. Retrieved 25 February 2015.
- 1 2 "London Borough Council Elections 2 May 2002" (PDF). London Datastore. Greater London Authority. Retrieved 25 February 2015.
- ↑ "London Borough Council Elections 9 May 1968" (PDF). London Datastore. Greater London Council. Retrieved 24 February 2015.
- 1 2 "London Borough Council Elections 13 May 1971" (PDF). London Datastore. Greater London Council. Retrieved 3 March 2015.
- 1 2 "London Borough Council Elections 2 May 1974" (PDF). London Datastore. Greater London Council. Retrieved 25 February 2015.
- 1 2 "London Borough Council By-elections May 1990 to May 1994" (PDF). London Datastore. London Research Centre. Retrieved 8 March 2015.
- 1 2 3 4 5 "London Borough Council Elections 7 May 1998 including the Greater London Authority Referendum results" (PDF). London Datastore. London Research Centre. Retrieved 8 March 2015.
- 1 2 3 "London Borough Council Elections 4 May 2006" (PDF). London Datastore. Greater London Authority. Retrieved 7 March 2015.
- 1 2 "Local by-elections results". Retrieved 15 September 2012.
- ↑ "Cranbrook ward by-election". redbridge.gov.uk. Retrieved 2008-07-20.
- ↑ "London Borough Council Elections 6 May 2010" (PDF). London Datastore. Greater London Authority. Retrieved 7 March 2015.
- ↑ http://www.redbridge.gov.uk/electionresults/2010/local-by/chadwell
- ↑ http://www.bnp.org.uk/news/regional/british-national-party-take-%E2%80%98i-love-london-campaign%E2%80%99-redbridge
- ↑ http://www.redbridge.gov.uk/cms/the_council/council_people_and_elections/elections/election_results/aldborough_ward_by-election_re.aspx