Waltham Forest London Borough Council election, 2014
| | |||||||||||||||||||||||||||||||||||||||||||||||||||||||||||||||||||||||||||||||||||||||
| |||||||||||||||||||||||||||||||||||||||||||||||||||||||||||||||||||||||||||||||||||||||
| |||||||||||||||||||||||||||||||||||||||||||||||||||||||||||||||||||||||||||||||||||||||
|
| |||||||||||||||||||||||||||||||||||||||||||||||||||||||||||||||||||||||||||||||||||||||
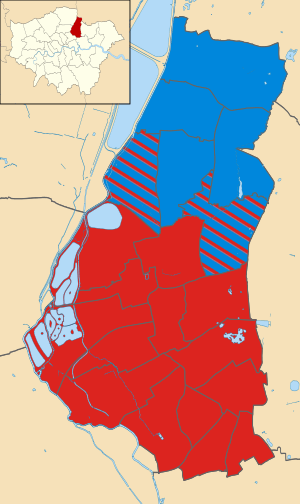
| Map of the results of the 2014 Waltham Forest council election. Conservatives in blue and Labour in red. | |||||||||||||||||||||||||||||||||||||||||||||||||||||||||||||||||||||||||||||||||||||||
| |||||||||||||||||||||||||||||||||||||||||||||||||||||||||||||||||||||||||||||||||||||||
The 2014 Waltham Forest Council election took place on 22 May 2014 to elect members of Waltham Forest Council in England.[1] This was on the same day as other local elections.
Eligibility
All locally registered electors (British, Irish, Commonwealth and European Union citizens) who were aged 18 or over on Thursday 22 May 2014 were entitled to vote in the local elections. Those who were temporarily away from their ordinary address (for example, away working, on holiday, in student accommodation or in hospital) were also entitled to vote in the local elections,[2] although those who had moved abroad and registered as overseas electors cannot vote in the local elections. It is possible to register to vote at more than one address (such as a university student who had a term-time address and lives at home during holidays) at the discretion of the local Electoral Register Office, but it remains an offence to vote more than once in the same local government election.[3]
Composition before election
| Elected in 2010 | Before election | ||||
|---|---|---|---|---|---|
| Party | Seats | Party | Seats | ||
| Labour | 36 | Labour | 35 | ||
| Conservative | 18 | Conservative | 18 | ||
| Liberal Democrat | 6 | Liberal Democrat | 6 | ||
| Vacant | 0 | Vacant | 1 | ||
Election result
| Waltham Forest Council election result 2014[4] | ||||||||||
|---|---|---|---|---|---|---|---|---|---|---|
| Party | Seats | Gains | Losses | Net gain/loss | Seats % | Votes % | Votes | +/− | ||
| Labour | 44 | 8 | 0 | |
73.3% | 43.8% | 35,048 | | ||
| Conservative | 16 | 0 | 2 | |
26.7% | 17.9% | 14,366 | | ||
| Liberal Democrat | 0 | 0 | 6 | |
0% | 12.7% | 10,146 | | ||
| Green | 0 | 0 | 0 | |
0% | 11.2% | 8,957 | | ||
| UKIP | 0 | 0 | 0 | |
0% | 8.9% | 7,122 | | ||
| TUSC | 0 | 0 | 0 | |
0% | 4.5% | 3,572 | | ||
Results by ward
The ward results listed below are based on the changes from the 2010 elections, not taking into account any mid-term by-elections or party defections.
| Party | Candidate | Votes | % | ||
|---|---|---|---|---|---|
| Labour | Keith Rayner | 1,779 | 20% | ||
| Labour | Patrick Edwards | 1,682 | 19% | ||
| Labour | Sally Littlejohn | 1,640 | 18% | ||
| Liberal Democrat | Liz Phillips | 985 | 11% | ||
| Liberal Democrat | Rupert Alexander | 837 | 9% | ||
| Liberal Democrat | Adrian Trett | 756 | 8% | ||
| Green | Pat Howie | 401 | 5% | ||
| Conservative | Guilherme de Gouveia | 264 | 3% | ||
| Conservative | Christopher Nott | 226 | 3% | ||
| Conservative | Joseph Leport | 196 | 2% | ||
| TUSC | Claire Laker-Mansfield | 134 | 2% | ||
| Turnout | 8,900 | ||||
| Labour hold | |||||
| Labour hold | |||||
| Labour gain from Liberal Democrat | |||||
| Party | Candidate | Votes | % | ||
|---|---|---|---|---|---|
| Labour | Naheed Asghar | 1,851 | 26% | ||
| Labour | Terry Wheeler | 1,782 | 25% | ||
| Labour | S.K.A. Highfield | 1,715 | 24% | ||
| Green | Glyn Roberts | 333 | 5% | ||
| UKIP | Sue Moorhead | 262 | 4% | ||
| Liberal Democrat | John Howard | 198 | 3% | ||
| Conservative | Carol Chatfield | 197 | 3% | ||
| Liberal Democrat | Clyde Kitson | 183 | 3% | ||
| Conservative | Erol Cakirgoz | 178 | 2% | ||
| Conservative | Jerry Leport | 168 | 2% | ||
| Liberal Democrat | Pam Bertram | 163 | 2% | ||
| TUSC | Marijerla Ratnaseelan | 92 | 1% | ||
| Turnout | 7,122 | ||||
| Labour hold | |||||
| Labour hold | |||||
| Labour hold | |||||
| Party | Candidate | Votes | % | ||
|---|---|---|---|---|---|
| Labour | Louise Mitchell | 1,953 | 20% | ||
| Labour | Paul Douglas | 1,927 | 20% | ||
| Labour | Steve Terry | 1,715 | 18% | ||
| Liberal Democrat | James Goodman | 690 | 7% | ||
| Green | Sue Wheat | 631 | 6% | ||
| Liberal Democrat | Tulat Raja | 580 | 6% | ||
| Liberal Democrat | Sean Meiszner | 575 | 6% | ||
| Conservative | Elliott Burton | 510 | 5% | ||
| UKIP | Judith Chisholm-Benli | 494 | 5% | ||
| Conservative | Kieran Sargent | 445 | 5% | ||
| TUSC | Glenroy Watson | 207 | 2% | ||
| Turnout | 9,727 | ||||
| Labour hold | |||||
| Labour hold | |||||
| Labour hold | |||||
| Party | Candidate | Votes | % | ||
|---|---|---|---|---|---|
| Conservative | Matt Davis | 1,659 | 20% | ||
| Conservative | Andy Hemsted | 1,624 | 19% | ||
| Conservative | Nick Halebi | 1,476 | 18% | ||
| UKIP | Martin Levin | 915 | 11% | ||
| Labour | Jeffrey Blay | 700 | 8% | ||
| Labour | Martin Dore | 628 | 8% | ||
| Labour | Neil Weeks | 588 | 7% | ||
| Liberal Democrat | Joan Carder | 262 | 3% | ||
| Independent | None of the Above | 204 | 2% | ||
| Liberal | Kathleen Mudie | 169 | 2% | ||
| TUSC | Manny Thain | 105 | 1% | ||
| Turnout | 8,330 | ||||
| Conservative hold | |||||
| Conservative hold | |||||
| Conservative hold | |||||
| Party | Candidate | Votes | % | ||
|---|---|---|---|---|---|
| Conservative | Roy Berg | 1,766 | 20% | ||
| Conservative | Peter Herrington | 1,588 | 18% | ||
| Conservative | Caroline Erics | 1,538 | 18% | ||
| UKIP | John O'Shea | 942 | 11% | ||
| Labour | Sheila Dore | 780 | 9% | ||
| Labour | Kenneth Kennedy | 765 | 9% | ||
| Labour | Peter Woodrow | 628 | 7% | ||
| Green | Kevin O'Brien | 399 | 5% | ||
| Liberal Democrat | Ted Cooke | 232 | 3% | ||
| TUSC | Sarah Sachs-Eldridge | 122 | 1% | ||
| Turnout | 8,760 | ||||
| Conservative hold | |||||
| Conservative hold | |||||
| Conservative hold | |||||
| Party | Candidate | Votes | % | ||
|---|---|---|---|---|---|
| Labour | Shabana Dhedhi | 1,694 | 17% | ||
| Labour | Kastriot Berberi | 1,636 | 17% | ||
| Labour | Gerry Lyons | 1,545 | 16% | ||
| Liberal Democrat | Farooq Qureshi | 1,136 | 12% | ||
| Liberal Democrat | Arfan Abrahim | 997 | 10% | ||
| Liberal Democrat | Murle Mitchell | 844 | 9% | ||
| Green | Daniel Ritman | 504 | 5% | ||
| UKIP | Ron Bromley | 303 | 3% | ||
| Conservative | Julien Foster | 296 | 3% | ||
| Conservative | Laurie Braham | 272 | 3% | ||
| Conservative | Derek Pryor | 264 | 3% | ||
| TUSC | Pat Brown | 161 | 2% | ||
| TUSC | Russell Pennington | 88 | 1% | ||
| TUSC | CEA Guiste | 75 | 1% | ||
| Turnout | 9,815 | ||||
| Labour hold | |||||
| Labour hold | |||||
| Labour gain from Liberal Democrat | |||||
| Party | Candidate | Votes | % | ||
|---|---|---|---|---|---|
| Labour | Chris Robbins | 1,858 | 18% | ||
| Labour | Anna Mbachu | 1,751 | 17% | ||
| Labour | Khevyn Limbajee | 1,686 | 16% | ||
| Liberal Democrat | Imran Mahmood | 1,009 | 10% | ||
| Liberal Democrat | Naser Masood | 865 | 8% | ||
| Liberal Democrat | Andrei Ilies | 856 | 8% | ||
| Green | Bill Measure | 507 | 5% | ||
| Green | Maureen Measure | 485 | 5% | ||
| Conservative | Jacqueline Howe | 345 | 3% | ||
| Conservative | Pervalz Khan | 335 | 3% | ||
| Conservative | Lauren Smith | 335 | 3% | ||
| TUSC | Nic Fripp | 160 | 2% | ||
| TUSC | Tim Roedel | 86 | 1% | ||
| Turnout | 10,278 | ||||
| Labour hold | |||||
| Labour hold | |||||
| Labour hold | |||||
| Party | Candidate | Votes | % | ||
|---|---|---|---|---|---|
| Conservative | Sheree Rackham | 1,412 | 14% | ||
| Labour | Tony Bell | 1,388 | 14% | ||
| Conservative | Paul Braham | 1,377 | 14% | ||
| Conservative | Darshan Singh Sunger | 1,286 | 13% | ||
| Labour | Simon Bottomley | 1,250 | 12% | ||
| Labour | Jonathan Lloyd | 1,108 | 11% | ||
| UKIP | Peter Woodrow | 580 | 6% | ||
| Green | Rebecca Redwood | 497 | 5% | ||
| Liberal Democrat | Gerry McGarry | 343 | 3% | ||
| Liberal Democrat | Sheila Smith-Pryor | 339 | 3% | ||
| Liberal Democrat | Jane Morgan | 315 | 3% | ||
| TUSC | Danny Byrne | 128 | 1% | ||
| Turnout | 10,023 | ||||
| Conservative hold | |||||
| Labour gain from Conservative | |||||
| Conservative hold | |||||
| Party | Candidate | Votes | % | ||
|---|---|---|---|---|---|
| Conservative | Marion Fitzgerald | 1,485 | 18% | ||
| Conservative | Geoffrey Walker | 1,249 | 15% | ||
| Conservative | Tim James | 1,134 | 14% | ||
| Labour | Stephen Garrett | 935 | 11% | ||
| UKIP | Paul Hillman | 868 | 11% | ||
| Labour | Graham Smith | 743 | 9% | ||
| Labour | Nicholas Russell | 741 | 9% | ||
| Green | Robert Tatam | 575 | 7% | ||
| Liberal Democrat | Marc Jones | 252 | 3% | ||
| TUSC | Sue Wills | 152 | 2% | ||
| Turnout | 8,134 | ||||
| Conservative hold | |||||
| Conservative hold | |||||
| Conservative hold | |||||
| Party | Candidate | Votes | % | ||
|---|---|---|---|---|---|
| Labour | Clare Coghill | 2,510 | 22% | ||
| Labour | Raja Anwar | 2,191 | 19% | ||
| Labour | Liaquat Ali | 2,095 | 18% | ||
| Liberal Democrat | Mahmood Hussain | 741 | 7% | ||
| Liberal Democrat | Bob Wheatley | 708 | 6% | ||
| Green | Harry Greenfield | 708 | 6% | ||
| Liberal Democrat | Nelia Cetin | 618 | 5% | ||
| Conservative | Michael Bamber | 314 | 3% | ||
| Conservative | Rachel Wedderburn | 267 | 2% | ||
| Conservative | Shane Clapham | 251 | 2% | ||
| TUSC | Nancy Taaffe | 240 | 2% | ||
| TUSC | Marvin Hay | 195 | 2% | ||
| Independent | James O'Rourke | 163 | 1% | ||
| Independent | John Macklin | 155 | 1% | ||
| TUSC | Senan Uthayasenan | 152 | 1% | ||
| Turnout | 11,328 | ||||
| Labour hold | |||||
| Labour hold | |||||
| Labour gain from Liberal Democrat | |||||
| Party | Candidate | Votes | % | ||
|---|---|---|---|---|---|
| Labour | Karen Bellamy | 2,275 | 24% | ||
| Labour | Tim Bennett-Goodman | 2,098 | 22% | ||
| Labour | Alistair Strathern | 1,921 | 21% | ||
| Liberal Democrat | Tahir Raja | 516 | 6% | ||
| Liberal Democrat | Peter Woollcott | 497 | 5% | ||
| Liberal Democrat | Patrick Smith | 475 | 5% | ||
| UKIP | David Bracegirdle | 450 | 5% | ||
| Conservative | Kathy Berg | 288 | 3% | ||
| Conservative | Colin Mace | 242 | 3% | ||
| Conservative | Robert Cantwell | 238 | 2% | ||
| TUSC | Mike Cleverley | 207 | 2% | ||
| TUSC | Louise Cuffaro | 128 | 1% | ||
| Turnout | 9,335 | ||||
| Labour hold | |||||
| Labour hold | |||||
| Labour hold | |||||
| Party | Candidate | Votes | % | ||
|---|---|---|---|---|---|
| Labour | Saima Mahmud | 2,279 | 23% | ||
| Labour | Mark Rusling | 2,226 | 22% | ||
| Labour | Ahsan Khan | 2,209 | 22% | ||
| Green | Stephen Lambert | 580 | 6% | ||
| Green | David Hamilton | 527 | 5% | ||
| Green | Anne Warrington | 513 | 4% | ||
| Conservative | Jonathan Canty | 375 | 4% | ||
| Conservative | Roger Hemsted | 333 | 3% | ||
| Conservative | Pamela Jovcic | 331 | 3% | ||
| TUSC | Paul Bell | 198 | 2% | ||
| Liberal Democrat | Jahanara Azim | 194 | 2% | ||
| Liberal Democrat | Peter Hatton | 192 | 1% | ||
| Liberal Democrat | Zeliha Yilmaz | 165 | 2% | ||
| Turnout | 10,122 | ||||
| Labour hold | |||||
| Labour hold | |||||
| Labour hold | |||||
| Party | Candidate | Votes | % | ||
|---|---|---|---|---|---|
| Conservative | John Moss | 1,428 | 17% | ||
| Conservative | Bernadette Mill | 1,421 | 17% | ||
| Conservative | Millie Balkan | 1,401 | 17% | ||
| Labour | Anne Garrett | 956 | 12% | ||
| Labour | Noel Hayes | 916 | 11% | ||
| Labour | Henrietta Jackson | 859 | 10% | ||
| UKIP | Richard King | 780 | 9% | ||
| Liberal Democrat | Jenny Sullivan | 169 | 2% | ||
| Liberal | Bob Carey | 154 | 2% | ||
| TUSC | Ian Pattison | 142 | 2% | ||
| Turnout | 8,226 | ||||
| Conservative hold | |||||
| Conservative hold | |||||
| Conservative hold | |||||
| Party | Candidate | Votes | % | ||
|---|---|---|---|---|---|
| Labour | Masood Ahmad | 2,259 | 25% | ||
| Labour | Mohammad Asghar | 2,020 | 22% | ||
| Labour | Yemi Osho | 1,871 | 21% | ||
| Green | Rachel Barrat | 619 | 7% | ||
| Liberal Democrat | Katy Andrews | 429 | 5% | ||
| Conservative | Jenny Cantwell | 379 | 4% | ||
| Liberal Democrat | Azhar Kayani | 375 | 4% | ||
| Conservative | Christopher Berg | 370 | 4% | ||
| Conservative | Carsten Lobo | 289 | 3% | ||
| TUSC | Martin Reynolds | 276 | 3% | ||
| Liberal Democrat | Marcin Nocek | 233 | 3% | ||
| Turnout | 9,120 | ||||
| Labour hold | |||||
| Labour hold | |||||
| Labour hold | |||||
| Party | Candidate | Votes | % | |
|---|---|---|---|---|
| Labour | Jacob Edwards | 1,973 | 19% | |
| Labour | Whitney Ihenachor | 1,923 | 19% | |
| Labour | Simon Miller | 1,786 | 17% | |
| Liberal Democrat | Bob Sullivan | 1,211 | 12% | |
| Liberal Democrat | Audrey Lee | 1,044 | 10% | |
| Liberal Democrat | Jerome Harvey-Agyei | 1,022 | 10% | |
| Green | Diana Wellings | 381 | 4% | |
| Conservative | James Edwards | 233 | 2% | |
| Conservative | Anne Pryor | 209 | 2% | |
| Conservative | Nicholas Hyett | 205 | 2% | |
| TUSC | Suzanne Beishon | 157 | 2% | |
| TUSC | Kevin Parslow | 130 | 1% | |
| Turnout | 10,274 | |||
| Labour gain from Liberal Democrat | ||||
| Labour gain from Liberal Democrat | ||||
| Labour gain from Liberal Democrat | ||||
| Party | Candidate | Votes | % | ||
|---|---|---|---|---|---|
| Labour | Clyde Loakes | 1,979 | 20% | ||
| Labour | Marie Pye | 1,947 | 19% | ||
| Labour | Jenny Gray | 1,905 | 19% | ||
| Green | Mark Dawes | 700 | 7% | ||
| Liberal Democrat | Suleman Ahmed | 652 | 6% | ||
| Liberal Democrat | Faiz Faiz | 598 | 6% | ||
| Liberal Democrat | Sadia Mirza | 566 | 6% | ||
| Conservative | Helen Johnson | 473 | 5% | ||
| Conservative | David Alt | 427 | 4% | ||
| Conservative | Molly Leport | 379 | 4% | ||
| TUSC | Suzanne Muna | 190 | 2% | ||
| TUSC | Len Hockey | 180 | 2% | ||
| TUSC | Aidan Taylor | 129 | 1% | ||
| Turnout | 10,125 | ||||
| Labour hold | |||||
| Labour hold | |||||
| Labour hold | |||||
| Party | Candidate | Votes | % | ||
|---|---|---|---|---|---|
| Labour | Sharon Waldron | 2,011 | 23% | ||
| Labour | Asim Mahmood | 1,952 | 23% | ||
| Labour | Johar Khan | 1,930 | 22% | ||
| Green | Claire Norman | 772 | 9% | ||
| Conservative | Stephen Murphy | 439 | 5% | ||
| Liberal Democrat | Matt Lake | 398 | 5% | ||
| TUSC | Dan Gillman | 362 | 4% | ||
| Liberal Democrat | Quintin Rubin | 209 | 3% | ||
| TUSC | Joel Hirsch | 268 | 3% | ||
| Liberal Democrat | Nund Lofur | 187 | 2% | ||
| Turnout | 8,609 | ||||
| Labour hold | |||||
| Labour hold | |||||
| Labour hold | |||||
| Party | Candidate | Votes | % | ||
|---|---|---|---|---|---|
| Conservative | Jemma Hemsted | 1,388 | 16% | ||
| Conservative | Alan Sigger | 1,318 | 15% | ||
| Labour | Aktar Beg | 1,160 | 13% | ||
| Conservative | Laurance Wedderburn | 1,100 | 13% | ||
| Labour | Jonathan O'Dea | 1,063 | 12% | ||
| Labour | Shumon Rahman | 1,033 | 12% | ||
| UKIP | John Murray | 793 | 9% | ||
| Liberal Democrat | Ian Paterson | 211 | 2% | ||
| Liberal Democrat | Shahnaz Malik | 205 | 2% | ||
| Liberal | Henry Boyle | 179 | 2% | ||
| TUSC | Sarah Wrack | 164 | 2% | ||
| Turnout | 8,614 | ||||
| Conservative hold | |||||
| Conservative hold | |||||
| Labour gain from Conservative | |||||
| Party | Candidate | Votes | % | ||
|---|---|---|---|---|---|
| Labour | Grace Williams | 2,441 | 24% | ||
| Labour | Nadeem Ali | 2,421 | 24% | ||
| Labour | Stuart Emmerson | 2,287 | 22% | ||
| Green | Huw Davies | 724 | 7% | ||
| UKIP | Ummer Farooq | 333 | 3% | ||
| Liberal Democrat | Jamie Cook | 317 | 3% | ||
| Conservative | Gilliam Hemsted | 290 | 3% | ||
| Conservative | Sheila Vero | 256 | 3% | ||
| Conservative | Mladen Jovcic | 233 | 2% | ||
| Liberal Democrat | Qaisar Iqbal | 222 | 2% | ||
| TUSC | Paula Mitchell | 185 | 2% | ||
| Liberal Democrat | Muhammad Irfan Kayani | 176 | 2% | ||
| TUSC | Kenneth Douglas | 149 | 1% | ||
| TUSC | Michael McClinton | 142 | 1% | ||
| Turnout | 10,176 | ||||
| Labour hold | |||||
| Labour hold | |||||
| Labour hold | |||||
| Party | Candidate | Votes | % | ||
|---|---|---|---|---|---|
| Labour | Angie Bean | 2,267 | 21% | ||
| Labour | Peter Barnett | 2,120 | 20% | ||
| Labour | Richard Sweden | 1,999 | 19% | ||
| Conservative | Ismet Balkan | 825 | 8% | ||
| Conservative | Abdul Alavi | 818 | 8% | ||
| Conservative | Riitta Soininen | 693 | 7% | ||
| Green | Roger Payne | 626 | 6% | ||
| UKIP | Bob Cox | 402 | 4% | ||
| Liberal Democrat | Naila Mahmood | 201 | 2% | ||
| TUSC | Lee Hawksbee | 190 | 2% | ||
| TUSC | Stephen Poole | 188 | 2% | ||
| Liberal Democrat | Maqsood Hussain | 173 | 2% | ||
| Liberal Democrat | Sahar Masih | 135 | 1% | ||
| Turnout | 10,637 | ||||
| Labour hold | |||||
| Labour hold | |||||
| Labour hold | |||||
References
- ↑ "England council results". BBC News. Retrieved 23 May 2014.
- ↑ "The Representation of the People (Form of Canvass) (England and Wales) Regulations 2006, Schedule Part 1". Legislation.gov.uk. 13 October 2011. Retrieved 18 April 2012.
- ↑ "I have two homes. Can I register at both addresses?". The Electoral Commission. Retrieved 5 January 2011.
- ↑ "Waltham Forest". London Councils. Retrieved 11 February 2015.