South Ribble Borough Council elections
South Ribble Borough Council in Lancashire, England is elected every four years. Since the last boundary changes in 2003, 55 councillors have been elected from 27 wards.[1]
Political control
Since the foundation of the council in 1973 political control of the council has been held by the following parties:[2]
| Party in control | Years |
|---|---|
| Conservative | 1973–1995 |
| Labour | 1995–1999 |
| No overall control | 1999–2007 |
| Conservative | 2007–present |
Council elections
- South Ribble Borough Council election, 1973
- South Ribble Borough Council election, 1976 (New ward boundaries)[3]
- South Ribble Borough Council election, 1979
- South Ribble Borough Council election, 1983
- South Ribble Borough Council election, 1987 (New ward boundaries & borough boundary changes also took place)[4][5]
- South Ribble Borough Council election, 1991
- South Ribble Borough Council election, 1995
- South Ribble Borough Council election, 1999
- South Ribble Borough Council election, 2003 (New ward boundaries increased the number of seats by 1)[6][7][8]
- South Ribble Borough Council election, 2007
- South Ribble Borough Council election, 2011
- South Ribble Borough Council election, 2015 (New ward boundaries)[9]
Borough result maps
-

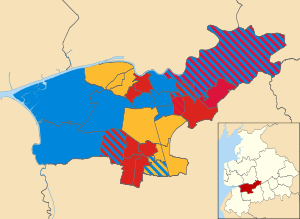
2003 results map
-

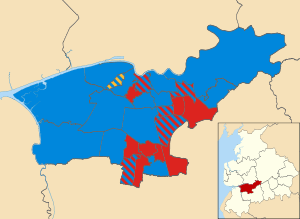
2007 results map
-

2011 results map
By-election results
1995-1999
| Party | Candidate | Votes | % | ± | |
|---|---|---|---|---|---|
| Labour | 1,600 | 45.2 | -0.1 | ||
| Conservative | 1,334 | 37.7 | +2.6 | ||
| Liberal Democrat | 608 | 17.2 | -2.4 | ||
| Majority | 266 | 7.5 | |||
| Turnout | 3,542 | ||||
| Labour hold | Swing | ||||
| Party | Candidate | Votes | % | ± | |
|---|---|---|---|---|---|
| Conservative | 507 | 57.5 | +15.8 | ||
| Labour | 260 | 29.5 | -5.0 | ||
| Liberal Democrat | 115 | 13.0 | -10.5 | ||
| Majority | 247 | 28.0 | |||
| Turnout | 882 | 22.5 | |||
| Conservative hold | Swing | ||||
| Party | Candidate | Votes | % | ± | |
|---|---|---|---|---|---|
| Labour | 398 | 47.6 | -17.3' | ||
| Conservative | 267 | 31.9 | +7.0 | ||
| Idle Toad | 98 | 11.7 | +11.7 | ||
| Liberal Democrat | 74 | 8.8 | -1.4 | ||
| Majority | 131 | 15.7 | |||
| Turnout | 837 | 20.0 | |||
| Labour hold | Swing | ||||
1999-2003
| Party | Candidate | Votes | % | ± | |
|---|---|---|---|---|---|
| Conservative | 356 | 42.2 | -10.3 | ||
| Liberal Democrat | 323 | 38.3 | +20.2 | ||
| Labour | 165 | 19.5 | -9.9 | ||
| Majority | 33 | 3.9 | |||
| Turnout | 844 | ||||
| Conservative hold | Swing | ||||
| Party | Candidate | Votes | % | ± | |
|---|---|---|---|---|---|
| Labour | 347 | 65.7 | -12.3 | ||
| Liberal Democrat | 121 | 22.9 | +22.9 | ||
| Conservative | 60 | 11.4 | -10.6 | ||
| Majority | 226 | 42.8 | |||
| Turnout | 528 | ||||
| Labour hold | Swing | ||||
| Party | Candidate | Votes | % | ± | |
|---|---|---|---|---|---|
| Liberal Democrat | 823 | 70.6 | +30.2 | ||
| Labour | 342 | 29.4 | -7.8 | ||
| Majority | 481 | 41.2 | |||
| Turnout | 1,165 | 24.8 | |||
| Liberal Democrat gain from Labour | Swing | ||||
2003-2007
| Party | Candidate | Votes | % | ± | |
|---|---|---|---|---|---|
| Liberal Democrat | Christine Leeming | 316 | 41.1 | +41.1 | |
| Conservative | John Cannon | 283 | 36.8 | -26.1 | |
| Labour | Graham Davies | 92 | 12.0 | -25.1 | |
| Idle Toad | Michael Nathan | 78 | 10.1 | +10.1 | |
| Majority | 33 | 4.3 | |||
| Turnout | 769 | 25.0 | |||
| Liberal Democrat gain from Conservative | Swing | ||||
| Party | Candidate | Votes | % | ± | |
|---|---|---|---|---|---|
| Liberal Democrat | James Leeming | 406 | 49.4 | -18.7 | |
| Conservative | Frances Thompson | 264 | 32.1 | +22.8 | |
| Labour | Donald Smith | 152 | 18.5 | -4.1 | |
| Majority | 142 | 17.3 | |||
| Turnout | 822 | 32.2 | |||
| Liberal Democrat hold | Swing | ||||
| Party | Candidate | Votes | % | ± | |
|---|---|---|---|---|---|
| Conservative | Michael McNulty | 594 | 51.5 | +11.5 | |
| Liberal Democrat | Richard Bridge | 431 | 37.4 | -6.4 | |
| Labour | Michaek Titherington | 128 | 11.1 | -5.1 | |
| Majority | 163 | 14.1 | |||
| Turnout | 1,153 | 40.0 | |||
| Conservative gain from Liberal Democrat | Swing | ||||
| Party | Candidate | Votes | % | ± | |
|---|---|---|---|---|---|
| Idle Toad | James Marsh | 364 | 44.0 | -16.4 | |
| Conservative | Frances Walker | 349 | 42.1 | +10.1 | |
| Labour | Houston Lowe | 91 | 11.0 | +3.4 | |
| Liberal Democrat | Karen Cairns | 24 | 2.9 | +2.9 | |
| Majority | 15 | 1.9 | |||
| Turnout | 828 | 28.6 | |||
| Idle Toad hold | Swing | ||||
| Party | Candidate | Votes | % | ± | |
|---|---|---|---|---|---|
| Labour | Michael Titherington | 1,051 | 61.2 | +7.6 | |
| Liberal Democrat | Richard Bridge | 342 | 20.0 | -7.7 | |
| Conservative | John Otter | 323 | 18.8 | +0.1 | |
| Majority | 709 | 41.2 | |||
| Turnout | 1,716 | ||||
| Labour hold | Swing | ||||
2007-2011
| Party | Candidate | Votes | % | ± | |
|---|---|---|---|---|---|
| Labour | Caleb Tomlinson | 371 | 34.5 | +1.1 | |
| Conservative | Phillip Hamman | 355 | 33.0 | -7.6 | |
| Liberal Democrat | Derek Forrest | 350 | 32.5 | +6.5 | |
| Majority | 16 | 1.5 | |||
| Turnout | 1,076 | ||||
| Labour gain from Conservative | Swing | ||||
| Party | Candidate | Votes | % | ± | |
|---|---|---|---|---|---|
| Conservative | Michael Nelson | 531 | 54.3 | -21.7 | |
| Labour | Daniel McDermott | 241 | 24.6 | +24.6 | |
| Liberal Democrat | Martin Cassell | 206 | 21.1 | -3.0 | |
| Majority | 290 | 29.7 | |||
| Turnout | 978 | ||||
| Conservative hold | Swing | ||||
| Party | Candidate | Votes | % | ± | |
|---|---|---|---|---|---|
| Conservative | Philip Hamman | 709 | '74.9 | +6.3 | |
| Labour | Peter Holker | 237 | 25.1 | +6.1 | |
| Majority | 472 | 49.8 | |||
| Turnout | 946 | ||||
| Conservative hold | Swing | ||||
2011-2015
| Party | Candidate | Votes | % | ± | |
|---|---|---|---|---|---|
| Labour | Mick Higgins | 481 | 55.0 | -2.4 | |
| Conservative | Barbara Nathan | 393 | 45.0 | +2.4 | |
| Majority | 88 | 10.1 | |||
| Turnout | 874 | 23.4 | |||
| Labour hold | Swing | ||||
References
- ↑ "Council and democracy". South Ribble Borough Council. Retrieved 2009-10-16.
- ↑ "South Ribble". BBC News Online. Retrieved 2009-10-16.
- ↑ The Borough of South Ribble (Electoral Arrangements) Order 1975
- ↑ The Lancashire (District Boundaries) Order 1986
- ↑ legislation.gov.uk - The Borough of South Ribble (Electoral Arrangements) Order 1987. Retrieved on 4 November 2015.
- ↑ "Local elections". BBC News Online. Retrieved 2009-10-16.
- ↑ legislation.gov.uk - The Borough of South Ribble (Electoral Changes) Order 2001. Retrieved on 4 October 2015.
- ↑ legislation.gov.uk - The Borough of South Ribble (Electoral Changes) (Amendment) Order 2002. Retrieved on 4 October 2015.
- ↑ legislation.gov.uk - The South Ribble (Electoral Changes) Order 2014. Retrieved on 3 November 2015.
- ↑ "Election of a councillor for the Walton-le-Dale ward" (PDF). South Ribble Borough Council. Retrieved 2009-10-16.
- ↑ "Election of a councillor for the Leyland St Ambrose ward" (PDF). South Ribble Borough Council. Retrieved 2009-10-16.
- ↑ "Election of a councillor for the Leyland St Mary's ward" (PDF). South Ribble Borough Council. Retrieved 2009-10-16.
- ↑ "Twin council win for Tories". guardian.co.uk. 2004-10-15. Retrieved 2009-10-16.
- ↑ "Election of a councillor for the Coupe Green & Gregson Lane ward" (PDF). South Ribble Borough Council. Retrieved 2009-10-16.
- ↑ "Golden Hill ward" (PDF). South Ribble Borough Council. Retrieved 2009-10-16.
- 1 2 "Declaration of result of poll" (PDF). South Ribble Borough Council. Retrieved 2009-10-16.
- ↑ "New councillor for Leyland". Lancashire Evening Post. 2009-10-16. Retrieved 2009-10-16.
- ↑ "Bamber Bridge East by-election result". South Ribble Borough Council. 14 October 2011. Retrieved 15 October 2011.
External links
This article is issued from Wikipedia - version of the 4/29/2016. The text is available under the Creative Commons Attribution/Share Alike but additional terms may apply for the media files.