Lancashire County Council election, 2009
Lancashire County Council election, 2009
|
|
|
|
|

|
| 2009 local election results in Lancashire |
|
|
A whole-council election to Lancashire County Council took place on 4 June 2009 as part of the 2009 United Kingdom local elections. The United Kingdom government department Department for Communities and Local Government consulted on the issue of moving the elections to the same date as the 2009 European Parliament election, which resulted in the council elections being postponed to June to coincide. 84 councillors were elected for 84 divisions by first-past-the-post' for a four-year term of office. Wards were the same as those at the previous election in 2005. Elections are held in all electoral divisions across the present ceremonial county, excepting Blackpool, and Blackburn with Darwen which are unitary authorities in a similar way to Greater Manchester and most of Merseyside.[1]
All locally registered electors (British, Irish, Commonwealth and European Union citizens) who were aged 18 or over on Thursday 4 June 2009 were entitled to vote in the local elections. Those who were temporarily away from their ordinary address (for example, away working, on holiday, in student accommodation or in hospital) were also entitled to vote in the local elections,[2] although those who had moved abroad and registered as overseas electors cannot vote in the local elections. It is possible to register to vote at more than one address (such as a university student who had a term-time address and lives at home during holidays) at the discretion of the local Electoral Register Office, but it remains an offence to vote more than once in the same local government election.[3]
Summary
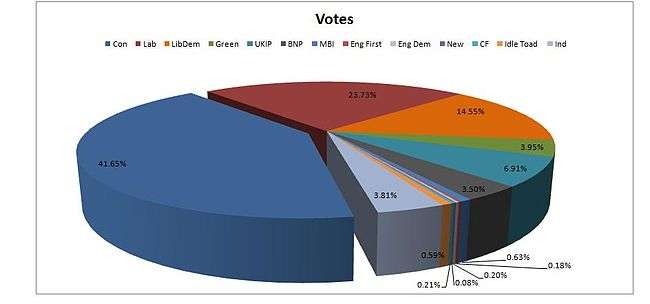
The election saw the Labour Party lose overall control of the council to the Conservative Party, who achieved an absolute majority. The Labour Party group became the council's official opposition.
Summary of Results
Elections were held in 2005 across Lancashire.
Summary of results 2005
| Party | Burnley | Chorley | Fylde | Hyndburn | Lancaster | Pendle | Preston | Ribble Valley | Rossendale | South Ribble | West Lancashire | Wyre | Total |
|---|
|
Labour |
6 | 4 | 0 | 6 | 6 | 1 | 6 | 0 | 3 | 5 | 4 | 3 | 44 |
|
Conservative |
0 | 3 | 5 | 0 | 3 | 2 | 3 | 3 | 2 | 1 | 4 | 5 | 31 |
|
Liberal Democrat |
0 | 0 | 0 | 0 | 0 | 3 | 1 | 1 | 0 | 1 | 0 | 0 | 6 |
|
Green |
0 | 0 | 0 | 0 | 1 | 0 | 0 | 0 | 0 | 0 | 0 | 0 | 1 |
|
Idle Toad |
0 | 0 | 0 | 0 | 0 | 0 | 0 | 0 | 0 | 1 | 0 | 0 | 1 |
|
Independent |
0 | 0 | 1 | 0 | 0 | 0 | 0 | 0 | 0 | 0 | 0 | 0 | 1 |
Summary of results 2009
| Party | Burnley | Chorley | Fylde | Hyndburn | Lancaster | Pendle | Preston | Ribble Valley | Rossendale | South Ribble | West Lancashire | Wyre | Total |
|---|
|
Labour |
0 | 1 | 0 | 3 | 2 | 2 | 5 | 0 | 0 | 0 | 2 | 1 | 16 |
|
Conservative |
0 | 6 | 3 | 2 | 6 | 4 | 3 | 3 | 5 | 6 | 6 | 7 | 51 |
|
Liberal Democrat |
5 | 0 | 1 | 0 | 0 | 0 | 2 | 1 | 0 | 1 | 0 | 0 | 10 |
|
Green |
0 | 0 | 0 | 0 | 2 | 0 | 0 | 0 | 0 | 0 | 0 | 0 | 2 |
|
Idle Toad |
0 | 0 | 0 | 0 | 0 | 0 | 0 | 0 | 0 | 1 | 0 | 0 | 1 |
|
Independent |
0 | 0 | 2 | 1 | 0 | 0 | 0 | 0 | 0 | 0 | 0 | 0 | 3 |
|
BNP |
1 | 0 | 0 | 0 | 0 | 0 | 0 | 0 | 0 | 0 | 0 | 0 | 1 |
|
Party results
Divisional results
| Seat | Result | Majority |
| | Burnley Central East | Liberal Democrats GAIN from Labour* | 72 |
| | Burnley Central West | Liberal Democrats GAIN from Labour | 586 |
| | Burnley North East | Liberal Democrats GAIN from Labour | 315 |
| | Burnley Rural | Liberal Democrats GAIN from Labour | 340 |
| | Burnley South West | Liberal Democrats GAIN from Labour | 1,041 |
| | Padiham and Burnley West | British National Party GAIN from Labour | 201 |
(* On Thursday, 6 May 2010, a by-election was held to fill the vacancy in Burnley Central East following the death of the sitting member. The result was a Labour GAIN from Liberal Democrat, majority 878.[4]
| Seat | Result | Majority |
| | Chorley East | Labour hold | 696 |
| | Chorley North | Conservative Hold | 1,592 |
| | Chorley Rural East | Conservative Hold | 762 |
| | Chorley Rural North | Conservative Hold | 899 |
| | Chorley Rural West | Conservative GAIN from Labour | 1,299 |
| | Chorley South | Conservative GAIN from Labour | 57 |
| | Chorley West | Conservative GAIN from Labour | 889 |
| Seat | Result | Majority |
| | Fylde East | Independent Hold | 987 |
| | Fylde South | Conservative Hold | 543 |
| | Fylde West | Independent GAIN from Conservative | 23 |
| | Lytham | Conservative Hold | 896 |
| | St Annes North | Liberal Democrat GAIN from Conservative | 547 |
| | St Annes South | Conservative Hold | 265 |
| Seat | Result | Majority |
| | Heysham | Conservative GAIN from Labour | 774 |
| | Lancaster Central | Green Party Hold | 412 |
| | Lancaster East | Green Party GAIN from Labour | 503 |
| | Lancaster Rural East | Conservative Hold | 1,206 |
| | Lancaster Rural North | Conservative Hold | 1,369 |
| | Lancaster South East | Conservative GAIN from Labour | 156 |
| | Morecambe North | Conservative hold | 1,135 |
| | Morecambe South | Conservative GAIN from Labour | 296 |
| | Morecambe West | Labour Hold | 140 |
| | Skerton | Labour Hold | 80 |
| Seat | Result | Majority |
| | Brierfield and Nelson North | Labour GAIN from Liberal Democrats | 279 |
| | Nelson South | Labour GAIN from Liberal Democrats | 529 |
| | Pendle Central | Conservative GAIN from Labour | 68 |
| | Pendle East | Conservative Hold | 1,644 |
| | Pendle West | Conservative Hold | 2,005 |
| | West Craven | Conservative GAIN from Liberal Democrats | 435 |
| Seat | Result | Majority |
| | Preston Central North | Labour Hold | 340 |
| | Preston Central South | Labour Hold | 412 |
| | Preston City | Labour Hold | 923 |
| | Preston East | Labour Hold | 297 |
| | Preston North | Conservative Hold | 1,261 |
| | Preston North East | Conservative Hold | 1,019 |
| | Preston North West | Liberal Democrats GAIN from Labour | 384 |
| | Preston Rural | Conservative Hold | 2,132 |
| | Preston South East | Labour Hold | 1,044 |
| | Preston West | Liberal Democrats Hold | 38 |
| Seat | Result | Majority |
| | Clitheroe | Liberal Democrats Hold | 23 |
| | Longridge with Bowland | Conservative Hold | 2,014 |
| | Ribble Valley North East | Conservative Hold | 2,021 |
| | Ribble Valley South West | Conservative Hold | 1,842 |
| Seat | Result | Majority |
| | Rossendale East | Conservative Hold | 586 |
| | Rossendale North | Conservative GAIN from Labour | 551 |
| | Rossendale South | Conservative Hold | 1,316 |
| | Rossendale West | Conservative GAIN from Labour | 416 |
| | Whitworth | Conservative GAIN from Labour | 37 |
| Seat | Result | Majority |
| | Bamber Bridge and Walton-le-Dale | Conservative GAIN from Labour | 546 |
| | Farington | Conservative GAIN from Labour | 758 |
| | Leyland Central | Conservative GAIN from Labour | 411 |
| | Leyland South West | Conservative GAIN from Labour | 810 |
| | Penwortham North | Liberal Democrats Hold | 91 |
| | Penwortham South | Conservative GAIN from Labour | 1,072 |
| | South Ribble Rural East | Idle Toad Hold | 434 |
| | South Ribble Rural West | Conservative Hold | 2,057 |
| Seat | Result | Majority |
| | Ormskirk West | Conservative GAIN from Labour | 497 |
| | Skelmersdale Central | Labour Hold | 697 |
| | Skelmersdale East | Conservative GAIN from Labour | 165 |
| | Skelmersdale West | Labour hold | 476 |
| | West Lancashire East | Conservative Hold | 1,248 |
| | West Lancashire North | Conservative Hold | 1,782 |
| | West Lancashire South | Conservative Hold | 1,344 |
| | West Lancashire West | Conservative Hold | 1,214 |
| Seat | Result | Majority |
| | Amounderness | Conservative Hold | 1,484 |
| | Fleetwood East | Labour Hold | 307 |
| | Fleetwood West | Conservative GAIN from Labour | 289 |
| | Garstang | Conservative Hold | 2,065 |
| | Poulton-le-Fylde | Conservative Hold | 1,750 |
| | Thornton-Cleveleys Central | Conservative Hold | 1,060 |
| | Thornton-Cleveleys North | Conservative GAIN from Labour | 464 |
| | Wyreside | Conservative Hold† | 2,435 |
†Wyreside fell vacant in August 2011 following the death of its councillor.[5] The subsequent by-election was held in October 2011 and was a Conservative hold[6]
References