Statistical geography
Statistical geography is the study and practice of collecting, analysing and presenting data that has a geographic or areal dimension, such as census or demographics data. It uses techniques from spatial analysis, but also encompasses geographical activities such as the defining and naming of geographical regions for statistical purposes. For example, for the purposes of statistical geography, the Australian Bureau of Statistics uses the Australian Standard Geographical Classification, a hierarchical regionalisation that divides Australia up into states and territories, then statistical divisions, statistical subdivisions, statistical local areas, and finally census collection districts.
Background

Geographers study how and why elements differ from place to place, as well as how spatial patterns change through time. Geographers begin with the question 'Where?', exploring how features are distributed on a physical or cultural landscape, observing spatial patterns and the variation of phenomena. Contemporary geographical analysis has shifted to 'Why?', determining why a specific spatial pattern exists, what spatial or ecological processes may have affected a pattern, and why such processes operate. Only by approaching the 'why?' questions can social scientists begin to appreciate the mechanisms of change, which are infinite in their complexity.
Role of statistics in geography
Statistical techniques and procedures are applied in all fields of academic research; wherever data are collected and summarized or wherever any numerical information is analyzed or research is conducted, statistics are needed for sound analysis and interpretation of results.
Geographers use statistics in numerous ways:
- To describe and summarize spatial data.
- To make generalizations concerning complex spatial patterns.
- To estimate the probability of outcomes for an event at a given location.
- To use samples of geographic data to infer characteristics for a larger set of geographic data (population).
- To determine if the magnitude or frequency of some phenomenon differs from one location to another.
- To learn whether an actual spatial pattern matches some expected pattern.
Spatial data and descriptive statistics
There are several potential difficulties associated with the analysis of spatial data, among these are boundary delineation, modifiable areal units, and the level of spatial aggregation or scale. In each of these cases, the absolute descriptive statistics of an area - the mean, median, mode, standard deviation, and variation - are changed through the manipulation of these spatial problems.
Boundary delineation
The location of a study area boundary and the positioning of internal boundaries affect various descriptive statistics. With respect to measures such as the mean or standard deviation, the study area size alone may have large implications; consider a study of per capita income within a city, if confined to the inner city, income levels are likely to be lower because of a less affluent population, if expanded to include the suburbs or surrounding communities, income levels will become greater with the influence of homeowner populations. Because of this problem, absolute descriptive statistics such as the mean, standard deviation, and variance should be evaluated comparatively only in relation to a particular study area. In the determination of internal boundaries this is also true, as these statistics may only have valid interpretations for the area and subarea configuration over which they are calculated.
Modifiable areal units
See also: Modifiable areal unit problem
In many cases the subdivision of spatial data has already been determined, this is evident in demographic datasets, as the available information will be grouped into their respective counties or municipalities. For this type of data, analysts must use the same county or municipal boundaries delineated in the collected data for their subsequent analysis. When alternate boundaries are possible, an analyst must take into account that any new subdivision model may create different results.
Spatial aggregation/scale problem
Socio-economic data may be available at a variety of scales, for example: municipalities, regional districts, census tracts, enumeration districts, or at the provincial/state level. When this data is aggregated at different scales, the resulting descriptive statistics may exhibit variations, either in a systematic, predictable way, or in a more uncertain fashion. If we are observing economic data, we may notice a distinct reduction in manufacturing productivity for a country (the USA) over a certain period; since this is a general model, individual states may experience these effects differently. The result of this aggregation is that the standard deviation of the data in question is increased due to the variability among states.
Descriptive spatial statistics
- See main article Spatial descriptive statistics
For summarizing point pattern analysis, a set of descriptive spatial statistics has been developed that are areal equivalents to nonspatial measures. Since geographers are particularly concerned with the analysis of locational data, these descriptive spatial statistics (geostatistics) are often applied to summarize point patterns and to describe the degree of spatial variability of some phenomena.
Spatial measures of central tendency
An example here is the idea of a center of population, of which a particular example is the mean center of U.S. population. Several different ways of defining a center are available:
- Mean center: The mean is an important measure of central tendency, which when extended to a set of points, located on a Cartesian coordinate system, the average location, centroid or mean center, can be determined.
- The weighted mean center is analogous to frequencies in the calculation of grouped statistics, such as the weighted mean. A point may represent a retail outlet, while its frequency will represent the volume of sales within the particular store.
- Median center or Euclidean center and in the median center of United States population. This is related to the Manhattan distance.
Spatial measures of dispersion
- Standard distance
Just as the standard deviation indicates how closely the values in a data set are clustered around the mean, so standard distance in a spatial distribution indicates how closely the points are clustered around the mean centre.
- Relative distance
Topology
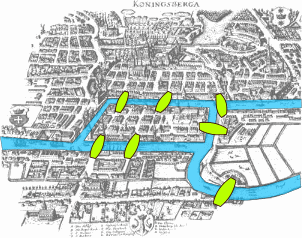
The motivating insight behind topology is that some geometric problems depend not on the exact shape of the objects involved, but rather on the "way they are connected together". One of the first papers in topology was the demonstration, by Leonhard Euler, that it was impossible to find a route through the town of Königsberg (now Kaliningrad) that would cross each of its seven bridges exactly once. This result did not depend on the lengths of the bridges, nor on their distance from one another, but only on connectivity properties: which bridges are connected to which islands or riverbanks. This problem, the Seven Bridges of Königsberg, is now a famous problem in introductory mathematics, and led to the branch of mathematics known as graph theory.
Topology rules
Topology rules are particularly important within GIS, and are used for a variety of correction and analytical procedures. The primary shapes in GIS are the point, line, and polygon, each of which implies different spatial characteristics; for instance, the only shape which has a distinguishable inside and outside is the polygon. Principles of connectivity associated with topology lead to applications in hydrology, urban planning, and logistics, as well as other fields; as such, topological analyses offer unique modelling capabilities, defining the vector nature of topological features and correcting spatial data errors from digitizing.
National Examples
United Kingdom
Due to the devolved nature of the United Kingdom, responsibility for managing statistical geographies often falls to the National Statistical Institute with jurisdiction for that devolved administration. For England and Wales this is the Office for National Statistics, for Scotland National Records of Scotland and for Northern Ireland the Northern Ireland Statistics and Research Agency.
England and Wales
The lowest form of statistical geography in England and Wales is the Output Area. These are small geographies of approximately 300 people and 100 households for which Census data is published. By containing roughly the same number of people and households it is possible to compare statistics for any two Output Areas in the country, and know that this is being done in a consistent way (unlike comparing statistics for Administrative geographies).
The Output Areas form the smallest part of a hierarchy that consists of Output Areas, Lower Layer Super Output Areas and Middle Layer Super Output Areas.
England and Wales also have a statistical geography designed specifically for the publication of workplace statistics. This is because Output Areas are built around residential populations and make analysing workplace statistics difficult. Workplace Zones have been released as part of the 2011 Census.
Scotland
Like England and Wales, the lowest level of statistical geography in Scotland is the Output Area. Scottish OAs are smaller than those for England and Wales because smaller thresholds are applied, but the methodology for their creation is broadly similar to that used by ONS.
The higher levels are again similar to England and Wales but operate as Data Zones and Intermediate Zones rather than Lower and Middle Layer Super Output Areas.
There are no Workplace Zones for Scotland.
See also
References
- Duncan, Otis Dudley, Raymond Paul Cuzzort and Beverly Duncan (1977). Statistical Geography: Problems in Analyzing Areal Data. Greenwood Press. ISBN 0-8371-9676-0.
- Dickinson, G.C. (1973). Statistical mapping and the presentation of statistics. Edward Arnold. ISBN 0-7131-5641-4.