Subatlantic
| Holocene Epoch |
|---|
| ↑ Pleistocene |
| Holocene |
The Subatlantic is the current climatic age of the Holocene epoch. It started at about 2,500 years BP and is still ongoing. Its average temperatures were slightly lower than during the preceding Subboreal and Atlantic. During its course the temperature underwent several oscillations which had a strong influence on fauna and flora and thus indirectly on the evolution of human civilizations. With intensifying industrialisation, human society started to stress the natural climatic cycles with increased greenhouse gas emissions.[1][2][3]
History and stratigraphy
The term subatlantic was first introduced in 1889 by Rutger Sernander[4] to differentiate it from Axel Blytt's atlantic.[5] It follows upon the previous subboreal. According to Franz Firbas (1949) and Litt et al. (2001) it consists of the pollen zones IX and X.[6][7] This corresponds in the scheme of Fritz Theodor Overbeck to the pollen zones XI and XII.[8]
In climate stratigraphy the subatlantic is usually subdivided into an older subatlantic and a younger subatlantic. The older subatlantic corresponds to pollen zone IX (or XI) characterized in central and northern Europe by beech or oak-beech forests, the younger subatlantic to pollen zone X (or XII).
In eastern Germany Dietrich Franke subdivides the subatlantic into four stages (from young to old):[9]
- youngest subatlantic: 1800 until present: modern history
- younger subatlantic: 1250 until 1800: High Middle Ages, Late Middle Ages, Early Modern Period
- middle subatlantic: 500 until 1250: migration period and Slavic migrations
- older subatlantic: 500 BC until 500 AD: pre-Roman iron age, ancient Rome and start of migration period.
Ages
The beginning of the subatlantic is usually defined as 2,400 calendar years BP or 450 BC. Yet this lower limit is by no means rigid. Some authors prefer to define the start of the subatlantic as 2,500 radiocarbon years which represents roughly 625 BC.[10] Occasionally the onset of the subatlantic has even been pushed back as far as 1200 BC.
According to Franz Firbas the changeover from the subboreal (pollen zone VIII) to the older subatlantic (pollen zone IX) is characterized by the recession of hazel and lime and the simultaneous spreading of hornbeam due to anthropogenic influences. This recession was not synchronous. It occurred in the western reaches of the Lower Oder valley between 930 and 830 BC,[11] whereas in southwestern Poland this event had taken place already between 1170 and 1160 BC.[12]
The beginning of the younger subatlantic at 1250 AD coincides with the medieval population increase and distinguishes itself by an increase in pine and in indicator plants for human settlements. In SW-Poland this event can be dated between 1050 and 1270 AD.[12] If one equates the onset of the younger subatlantic with the first maximum of beech occurrence it shifts back to Carolingian times around 700 AD.
Climatic evolution
The summer temperatures of the subatlantic are generally somewhat cooler (by up to 1.0 °C) than during the preceding subboreal, the yearly average temperatures reduced by 0.7 °C. At the same time the winter precipitations augmented by up to 50%. Overall the climate during the subatlantic therefore tends to cooler and wetter conditions. The lower limit of the glaciers in Scandinavia descended during the subatlantic by 100 to 200 meters.[13]
The beginning of the subatlantic opened at the middle of the first millennium BC with the so-called Roman Warm Period which lasted to the beginning of the 4th century. This corresponds broadly to classical antiquity. The optimum is marked by a temperature spike centered around 2,500 BP.[14] As a consequence in Europe the winter temperatures were raised by 0.6 °C during this period,[15] yet on average were still by 0.3 °C lower than during the subboreal. Ice cores from Greenland also demonstrate a distinct temperature rise after the younger subboreal. The cooling that followed coincides with the Migration Period. It was not very pronounced and of short duration – an average temperature drop of 0.2 °C and a winter temperature drop of 0.4 °C center around 350 AD (or 1,600 years BP). This climatic deterioration with the establishment of dryer and cooler conditions might have forced the Huns to move west thus in turn triggering the migrations of the Germanic tribes. At about the same time the Byzantine Empire reached its first acme and Christianity established itself in Europe as the leading monotheistic religion.
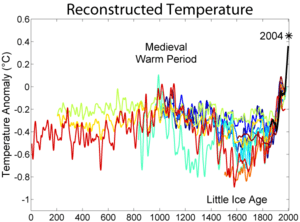
After this relatively short cool interlude the climate ameliorated again and reached between 800 and 1200 almost the values of the Roman Warm Period (used temperature proxies are sediments in the North Atlantic[16]). This warming happened during the High Middle Ages wherefore this event is known as Medieval Global Warming or the Medieval Warm Period. This warmer climate peaked around 850 AD and 1050 AD, and raised the tree line in Scandinavia and in Russia by 100 to 140 meters;[17] it enabled the Vikings to settle in Iceland and Greenland. During this period the Crusades took place and the Byzantine Empire was eventually pushed back by the rise of the Ottoman Empire.
The end of the Medieval Warm Period coincides with the early 14th century reaching a temperature minimum around 1350, and by the Crisis of the Late Middle Ages. Many settlements were abandoned and left deserted. As a consequence, the population in Central Europe drastically receded by as much as 50 percent.
After a short warming pulse around 1500, the Little Ice Age followed, lasting from c. 1550 until 1860. The Northern Hemisphere snow line descended by 100 to 200 meters.[18] Human history during this time includes the Renaissance and the Age of Enlightenment, and also major rebellious events like the Thirty Years War and the French Revolution. The beginning of the Industrial Revolution also dates back to this period, while Southeast Asia experienced the Dark ages of Cambodia.
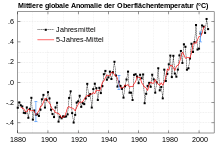
From 1860 onwards, the temperatures started to rise again and initiated the modern climatic optimum. This warming was severely amplified by anthropogenic influences (i.e. increasing industrialisation, greenhouse gas emissions and global warming). The modern warming shows a distinct temperature rise from the 1970s onwards. According to NASA, this is not expected to change within the 21st century.[19]
Atmosphere
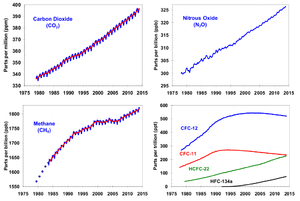
Ice core analyses from Greenland and Antarctica show a very similar evolution in greenhouse gases. After a temporary minimum during the preceding subboreal and atlantic the concentrations of carbon monoxide, nitrous oxide and methane slowly started to rise during the Subatlantic. Since 1800 onwards this rise has dramatically accelerated paralleling roughly the concomittant temperature rise. For example, the CO2-concentration increased from 280 ppm to a recent value of nearly 400 ppm, methane from 700 to 1800 ppb and N2O from 265 to 320 ppb.[20] A comparable rise had already taken place at the changeover to the Holocene, but this process then took nearly 5,000 years. This sudden release of greenhouse gases into the atmosphere by human society represents an unprecedented experiment with unpredictable consequences for Earth's climate.[21][22][23] Within the same context the release of juvenile water tied up in fossil fuels like coal, lignite, gas and petrol is generally overlooked.
Sea level

During the 2,500 year duration of the subatlantic global sea level kept on rising by about 1 meter. This corresponds to a rather low rate of 0.4 millimeters per year. Yet at the end of the 19th century a drastic change can be witnessed with a rate increase to 1.8 mm per year in the period 1880 to 2000. In the last twenty years alone satellite measurements document a rise of 50 millimeters which corresponds to a sixfold increase on the pre-industrial rate and a new rise of 2.5 millimeters per year.
Evolution in the Baltic
Today's sea level was already reached during the oldest subatlantic by the third Litorina transgression. The sea level rise had amounted to 1 meter, since then it oscillated around the zero mark. The transgression established during the postlitorine phase the Limnea Sea,[24] which is characterized by lower salinity compared with the preceding Littorina Sea due to an isostatic shallowing of the Danish sea straits (Great Belt, Little Belt and Öresund). As a consequence the sea snail Littorina littorea was gradually replaced by the freshwater snail Limnaea ovata.[25]
During the middle subatlantic about 1,300 years ago another rather weak sea level rise took place. Yet the salinity kept falling and therefore new freshwater species were able to immigrate. During the younger and youngest subatlantic about 400 years ago the Limnea Sea was replaced by the Mya Sea as distinguished by the immigration of the clam Mya arenaria which eventually gave way to the recent Baltic Sea.[26]
Evolution of the North Sea area
In the North Sea area, which had experienced a slight sea level fall and sea level stagnation during the subboreal, the renewed transgressive pulses of the Dunkerque transgression during the older subatlantic achieved the recent level.
Vegetation history
The wet and cool older subatlantic (pollen zone IX a) is characterized in central Europe by an oak forest intruded more and more by beech (mixed oak forests with lime and elm or mixed oak forests with ash and beech). Humid terrains were generally occupied by alder and ash. The mixed oak forests lasted until the middle subatlantic (pollen zone IX b), which also had a wet but somewhat milder climate. Interspersed within the middle subatlantic are peaks in the occurrence of European beech and European hornbeam (mixed oak forests with beech or mixed oak forests with elm, hornbeam and beech).
During the younger subatlantic (pollen zone X a), whose wet and temperate climate resembled already today's conditions, a mixed or an almost pure beech forest established itself. Anthropogenic influences (i. e. agricultural land uses, grazing and forestry) that date back to the bronze age started to become dominant. The actual youngest subatlantic (pollen zone X b) with its wet and temperate climate shows a distinct precipitation gradient with decreasing rainfall from west to east. Natural and indigenous forest communities were severely diminished and more and more replaced by artificially managed forest communities.
In northwestern Germany mixed oak forests take up 40% amongst the total tree pollen during the older subatlantic and are therefore dominant. Afterwards their count starts fluctuating and they are definitely receding during the younger subatlantic. The percentage of elms and limes as members of the mixed oak forests yet stayed constant. Alders receded from 30 to 10%. Pine trees were also receding but peaked during the youngest subatlantic due to forestry. Hazel (15%), birch (5%) and willow (< 1%) roughly kept their numbers. Significant was the spreading of beech (from 5 to 45%) and hornbeam (from 1 to 15%).[27] According to H. M. Müller the spreading of beech was caused by an increase in humidity since 550 BC and later favoured by a decrease in human settlements during the migrations.[28]
Herbs like cornflower, atriplex, sorrel and plantago also show a pronounced rise from 15 to 65% amongst the total pollen. Cereals were also on the increase – they augmented from 5 to 30% and clearly document an expanding agriculture during the younger subatlantic.
In northern Germany (Ostholstein) the vegetational evolution was very similar.[29] Remarkable here is the rapid rise of non-tree pollen from 30 to more than 80% (including an increase in cereals from 2 to over 20%) during the younger subatlantic. Amongst the tree pollen the mixed oak forest was able to keep its share of 30%. Alders were also retreating from 40 to 25%. Let alone small fluctuations birch, beech and hornbeam overall conserved their share (hornbeam showed a distinct peak at the beginning younger subatlantic). Pine trees were also augmenting during the youngest subatlantic.
Several distinct events could be recognized (from young to old):
- Spreading of pine trees (K) - at about 1800 - due to forestry
- second beech peak (F 2)
- first beech peak (F 1) - at about 1300 AD,[30] in Lower Saxony already at about 800 AD.
- fifth hazel peak (C 5) - at about 200 to 400 AD[31] - due to climatic reasons
Fauna and Flora
Faunal diversity has severely suffered since the middle of the 19th century by forced industrialisation and the concomitant pollution of the environment. This trend has reached alarming proportions since 1975. According to the Living Planet Index vertebrates have so far suffered a loss of 40% of their species. Freshwater taxa have even been more severely affected — they have lost up to 50%, mainly due to biotope loss and water pollution. According to NASA, agriculture, fisheries and ecosystems will be increasingly compromised in the Northeastern United States. In the Southeastern United States, increasing wildfires, insect outbreaks and tree diseases are causing widespread tree die-off. [32]
See also
References
- ↑ http://www.acs.org/content/acs/en/climatescience/greenhousegases/industrialrevolution.html
- ↑ http://www.epa.gov/climatechange/ghgemissions/gases/co2.html
- ↑ http://www.columbia.edu/~vjd1/greenhouse.htm
- ↑ Sernander, R. (1889). Om växtlämningar i Skandinaviens marina bildningar. Bot. Not. 1889, p. 190-199, Lund.
- ↑ Blytt, A. (1876a). Immigration of the Norvegian Flora. Alb. Cammermeyer, Christiania (Oslo), p. 89.
- ↑ Firbas, F. (1949). Spät- und nacheiszeitliche Klimageschichte Mittel-Europas nördlich der Alpen. I. Allgemeine Waldgeschichte, p. 480, Jena.
- ↑ Litt, T. et al. (2001). Correlation and synchronisation of Lateglacial continental sequences in northern central Europe based on annually laminated lacustrine sediments. Quaternary Science Reviews, 20, p. 1233–1249.
- ↑ Overbeck, F. (1950a). Die Moore Niedersachsens. 2. Aufl. Veröff. d. niedersächs. Amtes f. Landesplanung u. Statistik, Reihe A I, Abt. Bremen-Horn, vol. 3, 4.
- ↑ Franke, D. (2010). Regionale Geologie von Ostdeutschland – Ein Wörterbuch.
- ↑ Mangerud, J. et al. (1974). Quaternary stratigraphy of Norden, a proposal for terminology and classification. Boreas, 3, p. 109-128. Oslo.
- ↑ Jahns, S. (2000). Late-glacial and Holocene woodland dynamics and land-use history of the Lower Oder valley, north-eastern Germany, based on two, AMS 14C-dated, pollen profiles. Vegetation History and Archaeobotany, 9(2), P. 111-123.
- 1 2 Herking, C. M. (2004). Pollenanalytische Untersuchungen zur holozänen Vegetationsgeschichte entlang des östlichen unteren Odertals und südlichen unteren Wartatals in Nordwestpolen. Dissertation. Göttingen, Georg-August-Universität.
- ↑ Dahl, S. O. and Nesje, A. (1996). A new approach to calculating Holocene winter precipitation by combining glacier equilibrium-line altitudes and pine-tree limits: a case study from Hardangerjøkulen, central southern Norway. The Holocene,6, p. 381–398.
- ↑ Broecker, W. S. (2001). Was the Medieval Warm Period global? Science, 291, N°5508, p. 1497-1499.
- ↑ Bond, G. (2001). Persistent Solar Influence on North Atlantic Climate During the Holocene. Science, 294, N° 5594, p. 2130-2136.
- ↑ Keigwin, L. D. (1996). The Little Ice Age and Medieval Warm Period in the Sargasso Sea. Science, 274, p. 1504-1508.
- ↑ Hiller, A., Boettger, T. and Kremenetski, C. (2001). Medieval climatic warming recorded by radiocarbon dated alpine tree-line shift on the Kola Peninsula, Russia. Holocene, 11, 4, p. 491.
- ↑ Porter, S. C. (1986). Pattern and Forcing of Northern Hemisphere Glacier Variations during the Last Millennium. Quaternary Research, 26, p. 27-48.
- ↑ "Global temperature rise". NASA Climate Change. NASA. Retrieved 8 September 2016.
- ↑ Jansen, E. et al. (2007). Palaeoclimate. In: Climate Change 2007: The Physical Science Basis. Contribution of Working Group I to the Fourth Assessment Report of the Intergovernmental Panel on Climate Change. Solomon, S., D. Qin, M. Manning, Z. Chen, M. Marquis, K. B. Averyt, M. Tignor and H. L. Miller (editors). Cambridge University Press. Cambridge, United Kingdom and New York, NY, USA.
- ↑ http://www.desdemonadespair.net/2013/11/greenhouse-gas-concentrations-in.html
- ↑ http://www.theecologist.org/News/news_round_up/2137673/greenhouse_gases_alone_are_causing_unprecedented_arctic_warming.html
- ↑ http://www.ipcc.ch/publications_and_data/ar4/wg1/en/faq-7-1.html
- ↑ Hupfer, Peter (1981). Die Ostsee – kleines Meer mit großen Problemen. Leipzig, BSB B. G. Teubner Verlagsgesellschaft.
- ↑ Hyvärinen, H. et al. (1988). The Litorina Sea and Limnea Sea in the northern and central Baltic. Donner, J. & Raukas, A. (editors): Problems of the Baltic Sea History. Annales Academiae Scientiarum Fennicae, Series A, III. Geologica-Geographica, 148, p. 25–35.
- ↑ Hesssland, I. (1945). On the Quaternary Mya Period in Europe. Arkiv för Zoologi, 37(8), p. 1–51.
- ↑ Schmitz, H. (1956). Die pollenanalytische Gliederung des Postglazials im nordwestdeutschen Flachland. Eiszeitalter und Gegenwart, 6, p. 52–59.
- ↑ Müller, H. M. (1969). Die spätpleistozäne und holozäne Vegetationsentwicklung im östlichen Tieflandsbereich der DDR zwischen Nördlichem und Südlichem Landrücken. Wissenschaftliche Abhandlungen der Geographischen Gesellschaft der DDR, 10, P. 155–165.
- ↑ Schmitz, H. (1953). Die Waldgeschichte Ostholsteins und der zeitliche Verlauf der postglazialen Transgression an der holsteinischen Ostseeküste. Ber. Deutsch. Bot. Ges. 6, 6, P. 151-166.
- ↑ Mikkelsen, V. M. (1952). Pollenanalytiske undersogelser ved Bolle, et bidrag til Vegetationshistorien i subatlantisk tid. Nationalmuseets 3. afd. Arkaeologiske Landsbyundersegelser, 1, p. 109–132, Kopenhagen.
- ↑ Schütrumpf, R. (1951b). Die pollenanalytische Untersuchung eisenzeitlicher Funde aus dem Rüder Moor, Kreis Schleswig|Sammelwerk=Offa, Ber. u. Mitt. Mus. vorgesch. Altert. Schleswig u. Inst. f. Ur- u. Frühgesch. Univ. Kiel, 9, p. 53–57.
- ↑ "US Regional Effects". NASA Global Climate Change. Retrieved 8 September 2016.
| Quaternary | ||
|---|---|---|
| Pleistocene | Holocene | |
| Early | Middle | Late | Preboreal | Boreal | Atlantic | Subboreal | Subatlantic | |