United States gubernatorial elections, 2000
| | ||||||||||||||||||||||||||||||||
| ||||||||||||||||||||||||||||||||
| ||||||||||||||||||||||||||||||||
|
| ||||||||||||||||||||||||||||||||
| Results: Republican holds Democratic holds Democratic pickups | ||||||||||||||||||||||||||||||||
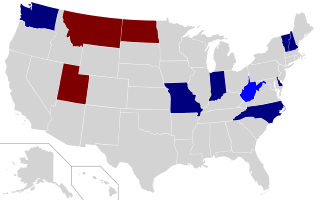
United States gubernatorial elections were held on November 7, 2000 in 11 states and two territories. The elections coincided with the presidential election.
Election results
Only the governorship of West Virginia changed party hands in 2000 when Democrat Bob Wise defeated Republican incumbent Cecil Underwood.
Bolded state name features an article about the specific election.
| State | Incumbent | Party | Status | Opposing Candidates |
|---|---|---|---|---|
| Delaware | Tom Carper | Democratic | Term-Limited, Democratic victory | Ruth Ann Minner (Democratic) 59.2% John Burris (Republican) 39.7% Floyd McDowell (Ind. Delaware) 1.1% |
| Indiana | Frank O'Bannon | Democratic | Re-elected, 56.6% | David McIntosh (Republican) 41.7% Andrew Horning (Libertarian) 1.8% |
| Missouri | Roger Wilson | Democratic | Retired, Democratic victory | Bob Holden (Democratic) 49.1% Jim Talent (Republican) 48.2% Larry Rice (Independent) 1.5% John Swenson (Libertarian) 0.5% Lavoy Reed (Green) 0.4% Richard Kline (Reform) 0.2% Richard Smith (Constitution) 0.1% |
| Montana | Marc Racicot | Republican | Term-Limited, Republican victory | Judy Martz (Republican) 51% Mark O'Keefe (Democratic) 47.1% Stan Jones (Libertarian) 1.9% |
| New Hampshire | Jeanne Shaheen | Democratic | Re-elected, 48.7% | Gordon Humphrey (Republican) 43.8% Mary Brown (Independent) 6.4% John Babiarz (Libertarian) 1.1% |
| North Carolina | Jim Hunt | Democratic | Term-Limited, Democratic victory | Mike Easley (Democratic) 52% Richard Vinroot (Republican) 46.3% Barbara Howe (Libertarian) 1.5% Douglas Schell (Reform) 0.3% |
| North Dakota | Ed Schafer | Republican | Retired, Republican victory | John Hoeven (Republican) 55% Heidi Heitkamp (Democratic) 45% |
| Utah | Mike Leavitt | Republican | Re-elected, 55.8% | Bill Orton (Democratic) 42.7% Jeremy Friedbaum (Independent American) 2% |
| Vermont | Howard Dean | Democratic | Re-elected, 50.4% | Ruth Dwyer (Republican) 37.9% Anthony Pollina (Progressive) 9.5% Phil Stannard (Independent) 0.7% Joel Williams (Vermont Grassroots) 0.5% Hardy Macia (Libertarian) 0.3% Richard Gottlieb (Liberty Union) 0.1% |
| Washington | Gary Locke | Democratic | Re-elected, 58.4 | John Carlson (Republican) 39.7% Steve LePage (Libertarian) 1.9% |
| West Virginia | Cecil Underwood | Republican | Defeated, 47.2% | Bob Wise (Democratic) 50.1% Denise Giardina (Mountain) 1.6% Bob Myers (Libertarian) 0.9% Randall Ashelman (Natural Law) 0.2% |
| Territory | Incumbent | Party | Status | Competing candidates |
|---|---|---|---|---|
| American Samoa[1] | Tauese Sunia | Democratic | Re-elected, 51.44% | Lealaifuaneva Peter Reid (Independent) 48.57% |
| Puerto Rico | Pedro Rosselló | PNP/Democratic | Retired, PPD/Democratic victory | Sila Calderón (PPD/Democratic) 48.6 Carlos Pesquera (PNP/Democratic) 45.7% Rubén Berríos (Puerto Rican Independence Party) 5.2% |
See also
References
This article is issued from Wikipedia - version of the 11/20/2016. The text is available under the Creative Commons Attribution/Share Alike but additional terms may apply for the media files.