1888 Atlantic hurricane season
| |
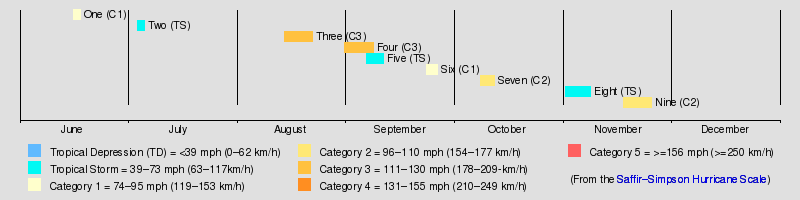
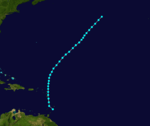
| Season summary map |
| First system formed |
June 16, 1888 |
| Last system dissipated |
November 25, 1888 |
| Strongest storm1 |
Three and Four – 125 mph (205 km/h) (1-minute sustained) |
| Total storms |
9 |
| Hurricanes |
6 |
| Major hurricanes (Cat. 3+) |
2 |
| Total fatalities |
924 |
| Total damage |
$2.7 million (1888 USD) |
| 1Strongest storm is determined by lowest pressure |
Atlantic hurricane seasons
1886, 1887, 1888, 1889, 1890 |
The 1888 Atlantic hurricane season ran through the summer and the first half of fall in 1888. In the 1888 Atlantic season there were two tropical storms, four hurricanes, and two major hurricanes. However, in the absence of modern satellite and other remote-sensing technologies, only storms that affected populated land areas or encountered ships at sea are known, so the actual total could be higher. An undercount bias of zero to six tropical cyclones per year between 1851 and 1885 and zero to four per year between 1886 and 1910 has been estimated.[1]
Timeline
Storms
Hurricane One
| Category 1 hurricane (SSHWS) |
|
|
| Duration |
June 16 – June 18 |
| Peak intensity |
80 mph (130 km/h) (1-min) 985 mbar (hPa) |
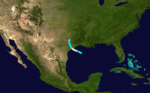
The first tropical storm and first hurricane of the season formed by 00:00 UTC on June 16 in the northwestern Gulf of Mexico, centered about 200 miles (322 km) southeast of Galveston Island, Texas. (Due to sparse observations, the system may have developed prior to this time, but was not detected.) The cyclone moved west-northwestward and quickly strengthened, becoming a hurricane late on June 16. It reached its peak intensity of 80 miles per hour (129 km/h) early on June 17. Around 06:00 UTC on June 17, the hurricane made landfall southwest of Bay City, Texas, over the eastern end of East Matagorda Bay. Turning to the northwest after landfall, it quickly degenerated into a tropical storm, gradually turning northward over time. By 06:00 UTC on June 18, it weakened into a tropical depression, and just 12 hours later it lost its identity near Waco, Texas.[2]
In Texas, the cyclone produced heavy rain, peaking at 6.4 inches (163 mm) over a 16-hour period at Galveston. The highest measured winds reached 54 mph (87 km/h) in the city.[3] Along the coast of Texas, the lowest measured pressure was 29.69 inches of mercury (1,005 mb) at Corpus Christi, about 120 miles (193 km) southwest of the landfall location.[4] The Atlantic hurricane reanalysis project estimated that the minimum central pressure in the storm was likely close to 985 millibars (29.09 inHg) at the time of landfall.[5] Operationally, the U.S. Signal Corps—predecessor to the U.S. Weather Bureau (now the National Weather Service)—did not classify the system as an area of low pressure, and it did not appear in the June 1888 track map of cyclones in the Monthly Weather Review, the official publication of the Signal Corps.[6] However, as early as June 17 the New York Times noted that a moderate storm was apparently approaching Texas.[7]
Tropical Storm Two
| Tropical storm (SSHWS) |
|
|
| Duration |
July 4 – July 6 |
| Peak intensity |
60 mph (95 km/h) (1-min) ≤1008 mbar (hPa) |
The second tropical storm of the season originated about 200 mi (322 km) east of the mouth of the Rio Grande, on the Texas–Mexico border. It moved north-northwest, attaining its peak intensity of 60 mph (97 km/h) by 00:00 UTC on July 5. About 16 hours later, the moderate tropical storm made landfall at that intensity just east of Bay City—impacting the same region as the previous storm. The cyclone turned north and north-northeast after striking land, slowly weakening as it did so. By 12:00 UTC on July 6, the cyclone was last positioned over northwestern Cherokee County, Texas.[2]
In Texas, the storm produced peak winds of 42 mph (68 km/h) in Galveston, and the lowest measured pressure was 29.78 inches of mercury (1,008 mb) in the city.[8] Like the preceding storm, the cyclone produced heavy rain over parts of Texas, especially in the Palestine area in Anderson County. In this area, a shower of pebbles, each ranging from 1⁄8–1⁄4 inch (0.32–0.64 cm) in diameter and irregularly shaped, was reported to have occurred,[9] possibly due to a tornado or waterspout that touched down at an unknown distance from Palestine.[10]
Hurricane Three
| Category 3 hurricane (SSHWS) |
|
|
| Duration |
August 14 – August 24 (extratropical on August 22) |
| Peak intensity |
125 mph (205 km/h) (1-min) 945 mbar (hPa) |
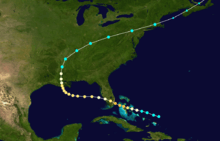
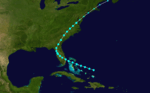
The third tropical storm and second hurricane of the season was first detected by 12:00 UTC on August 14, while centered about 100 mi (161 km) north-northeast of the Turks and Caicos Islands. (Operationally, the U.S. Signal Corps did not begin tracking the system until August 16, when it was first observed off South Florida.[11]) Moving west-northwestward, the tropical storm steadily intensified into a hurricane 24 hours later on August 15. It made landfall on Cat Island in The Bahamas, which were then a British crown colony and overseas territory. Continuing to intensify, the hurricane passed just 20 mi (32 km) south of the Bahamian capital Nassau, on New Providence Island, around 00:00 UTC on August 16 with winds of 105 mph (169 km/h). The cyclone, continuing to the west-northwest, then made another landfall on the northern end of Andros Island. As it neared the southeast coast of Florida, it strengthened into the equivalence of a major hurricane—Category 3 on the Saffir–Simpson hurricane wind scale—and attained peak winds of 125 mph (201 km/h), near the upper threshold of Category 3 intensity, by 12:00 UTC on August 16. About seven hours later, it made landfall just north of present-day Miami Beach at peak intensity. (This location was near present-day Upper Eastside in Miami.) The cyclone weakened as it moved inland over the Everglades, south of Lake Okeechobee, and by 06:00 UTC on August 17 passed out into the Gulf of Mexico near Matlacha and Cayo Costa. By that time maximum sustained winds had decreased to 80 mph (129 km/h). By 18:00 UTC on August 17, however, the cyclone regained intensity, and its path turned westward over the Gulf of Mexico. Early on August 18, the hurricane attained a second peak intensity of 110 mph (177 km/h). In the time before landfall in Louisiana, its path gradually bent to the northwest and north-northwest. Around 16:00 UTC on August 19, the cyclone made landfall south of Cocodrie, Louisiana, as the equivalence of a strong Category 2 hurricane. Turning northward after moving inland, the hurricane weakened to a strong tropical storm by 18:00 UTC on August 20, its path nearing Greenville, Mississippi, before curving to the northeast. Little more than a day later, it passed over southern New England, becoming extratropical by 12:00 UTC on August 22.[2]
As it passed over The Bahamas, the hurricane caused damage to fruit trees, crops, and fences, especially on the Abaco Islands, Harbour Island, and New Providence. Winds shifted from northeast and southwest, lasting about eight hours, but damage to shipping was minimal.[12] In South Florida, the hurricane struck a sparsely-populated section of the coast, but still produced widespread damage[13] as far north as Sebastian. The highest wind reported in South Florida was 60 mph (97 km/h) at Jupiter,[14] and the heaviest rainfall was 2.02 in (51 mm) at that location.[11] Farther north along the coast, winds at Sebastian Inlet were estimated at 75 mph (121 km/h), downing trees and telegraph poles; many small boats were pushed ashore, and "several thousand dollars" in damage were reported to local fruit groves.[13][15] Additionally, the hurricane reportedly produced a storm surge of 14 feet (4.3 m) "on the beaches near Miami."[13] In the Big Bend region of Florida, winds at Cedar Key reached 42 mph (68 km/h), accompanied by light rain, and caused several yachts to capsize.[15] Winds at Pensacola, in the Florida Panhandle, peaked at 60 mph (97 km/h), badly damaging local property.[15] Winds in Mobile, Alabama, peaked at 55 mph (89 km/h),[11] prostrating trees and fences, and a few homes lost their roofs.[16] Flooding from the storm surge was among the worst on record: the waterfront was flooded to a depth of 3 ft (0.91 m),[15] with floodwater extending two to three blocks inland from the Mobile River.[16] Along the Mississippi River Delta, the storm produced severe flooding.[13] Rainfall in New Orleans totaled 7.9 in (201 mm) over a 12-hour period, and winds in the city reached an estimated 90 mph (145 km/h);[11] in the city strong winds unroofed many buildings, downed numerous trees, and blew down fences. In many areas, strong winds downed at least one-third of the timber, and damage to rice, sugarcane, corn, and cotton crops was significant.[15][16] The lowest reported pressure in the Mississippi Delta was 29.37 inHg (995 mb) at Vicksburg, Mississippi, with other readings as low as 29.4 inHg (996 mb) in the Memphis area.[14] The storm produced heavy rainfall and high winds along much of its path across the Mississippi Valley, the Mid-Atlantic states, and the Northeastern United States.[11]
Hurricane Four
| Category 3 hurricane (SSHWS) |
|
|
| Duration |
August 31 – September 8 |
| Peak intensity |
125 mph (205 km/h) (1-min) ≤972 mbar (hPa) |
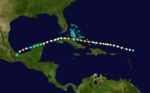
On August 31, a tropical storm was observed northeast of the Lesser Antilles. It moved westward, strengthening to a hurricane later that day. As it continued to strengthen, it brought heavy rain over Puerto Rico, the Turks and Caicos Islands, and Cuba. On the 3rd, it reached its peak of 130 mph, but land interaction with Cuba weakened it to a minimal hurricane. It crossed the island and the Yucatán Channel, reaching the northeast coast of the Yucatán Peninsula on the 6th. After weakening to a tropical storm, it restrengthened to a Category 2 hurricane while moving southwestward in the Bay of Campeche, but it dissipated after its Veracruz landfall on the 8th. It caused 921 deaths.
Tropical Storm Five
| Tropical storm (SSHWS) |
|
|
| Duration |
September 6 – September 11 |
| Peak intensity |
60 mph (95 km/h) (1-min) 999 mbar (hPa) |
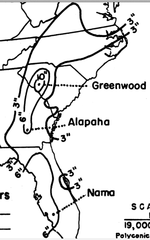
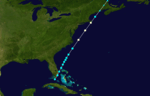
A tropical storm formed north of the Turks & Caicos Islands on September 6.It travelled north through the Florida Panhandle and continued northward along the east coast of the USA. The storm reached Maryland before becoming extratropical on September 11. The system dissipated near Ottawa on September 13. Across the United States, the storm deposited heavy rainfall from Florida through eastern Georgia through the Carolinas into southern Virginia. The heaviest total reported was 11.70 inches (297 mm) at Greenwood, South Carolina.[17]
Hurricane Six
| Category 1 hurricane (SSHWS) |
|
|
| Duration |
September 23 – September 26 |
| Peak intensity |
80 mph (130 km/h) (1-min) 985 mbar (hPa) |
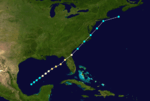
A tropical storm formed south of Key West on September 23 and began moving northeast.
It travelled parallel to the coast of Georgia, where it produced winds of 65 mph/100kph before becoming a Category 1 hurricane on September 26.It continued heading northeastward before it become extratropical on September 27 near the Gulf of St Lawrence.
Hurricane Seven
| Category 2 hurricane (SSHWS) |
|
|
| Duration |
October 8 – October 12 |
| Peak intensity |
110 mph (175 km/h) (1-min) 970 mbar (hPa) |
Hurricane seven developed on October 8 in the southern Gulf of Mexico.It moved slowly northeastward and strengthened to a category 2 hurricane with 110 mph winds as it made landfall on northwestern Florida. The system then moved up the east coast, while weakening to a tropical storm. This system had a pressure of 970 millibar at one point.
Tropical Storm Eight
| Tropical storm (SSHWS) |
|
|
| Duration |
November 1 – November 8 |
| Peak intensity |
60 mph (95 km/h) (1-min) |
Tropical storm eight formed close to the Windward Islands on November 1 and moved northward into the north Atlantic, while strengthening to 50 knots.
Hurricane Nine
| Category 2 hurricane (SSHWS) |
|
|
| Duration |
November 17 – November 25 |
| Peak intensity |
100 mph (155 km/h) (1-min) ≤982 mbar (hPa) |
A tropical storm formed north-east of Puerto Rico on November 17.By the morning of November 23, it had developed into a Category 2 hurricane, reaching wind speeds of 100 mph (155 km/h). It maintained that level of intensity throughout the 23rd, 24th and 25 November before weakening to become extratropical on November 26.As an extratropical storm it was active until December 2.
See also
References
- ↑ Landsea, C. W. (2004). "The Atlantic hurricane database re-analysis project: Documentation for the 1851–1910 alterations and additions to the HURDAT database". In Murname, R. J.; Liu, K.-B. Hurricanes and Typhoons: Past, Present and Future. New York: Columbia University Press. pp. 177–221. ISBN 0-231-12388-4.
- 1 2 3 National Hurricane Center; Hurricane Research Division (July 6, 2016). "Atlantic hurricane best track (HURDAT version 2)". United States National Oceanic and Atmospheric Administration. Retrieved December 5, 2016.
- ↑ "Winds" (PDF). Monthly Weather Review. Washington, D.C. 16 (6): 146–8. 1888. Bibcode:1888MWRv...16..146.. doi:10.1175/1520-0493(1888)16[146:w]2.0.co;2. Retrieved 27 November 2014.
- ↑ "Table of miscellaneous meteorological data for June, 1888—Signal Service observations" (PDF). Monthly Weather Review. Washington, D.C. 16 (6): 157–8. 1888. Bibcode:1888MWRv...16..157.. doi:10.1175/1520-0493(1888)16[157:tommdf]2.0.co;2. Retrieved 27 November 2014.
- ↑ National Hurricane Center; Hurricane Research Division; Atlantic Oceanographic and Meteorological Laboratory (February 2015). "Continental United States Hurricanes (Detailed Description)". aoml.noaa.gov. Miami: United States National Oceanic and Atmospheric Administration's Office of Oceanic & Atmospheric Research. Retrieved December 5, 2016.
- ↑ "Chart I. Tracks of Areas of Low Pressure. June, 1888" (PDF). Monthly Weather Review. Washington, D.C. 16 (6): c1. 1888. Bibcode:1888MWRv...16Y...1.. doi:10.1175/1520-0493(1888)166[c1:citoao]2.0.co;2. Retrieved 27 November 2014.
- ↑ "Weather". New York Times. June 17, 1888. p. 3.
- ↑ "Meteorological record of voluntary observers, &c." (PDF). Monthly Weather Review. Washington, D.C. 16 (7). 1888. Bibcode:1888MWRv...16..181.. doi:10.1175/1520-0493(1888)16[181:MROVOC]2.0.CO;2. Retrieved 27 November 2014.
- ↑ "Winds" (PDF). Monthly Weather Review. Washington, D.C. 16 (7): 173. 1888. Bibcode:1888MWRv...16..173.. doi:10.1175/1520-0493(1888)16[173:w]2.0.co;2. Retrieved 27 November 2014.
- ↑ "Can it rain frogs, fish, and other objects?". loc.gov. Library of Congress. Retrieved 27 November 2014.
- 1 2 3 4 5 "ATMOSPHERIC PRESSURE (expressed in inches and hundredths)" (PDF). Monthly Weather Review. Washington, D.C.: U.S. Signal Corps. 16 (8): 185–7. 1888. Bibcode:1888MWRv...16R.185.. doi:10.1175/1520-0493(1888)16[185b:APEIIA]2.0.CO;2. Retrieved 27 November 2014.
- ↑ "A hurricane in the Bahamas". Nassau, Bahamas: New York Times. August 25, 1888. p. 3.
- 1 2 3 4 Barnes 1998, p. 73
- 1 2 "Table of miscellaneous meteorological data for August, 1888——Signal Service observations" (PDF). Monthly Weather Review. Washington, D.C.: U.S. Signal Corps. 16 (8): 211–12. 1888. Bibcode:1888MWRv...16..211.. doi:10.1175/1520-0493(1888)16[211:tommdf]2.0.co;2. Retrieved 27 November 2014.
- 1 2 3 4 5 "Winds" (PDF). Monthly Weather Review. Washington, D.C.: U.S. Signal Corps. 16 (8): 198–200. 1888. Bibcode:1888MWRv...16..198.. doi:10.1175/1520-0493(1888)16[198:W]2.0.CO;2. Retrieved 27 November 2014.
- 1 2 3 "Storms south and west: railroads damaged, wires broken, and buildings wrecked". New York Times. August 21, 1888. p. 1.
- ↑ United States Corp of Engineers (1945). Storm Total Rainfall In The United States. War Department. p. SA 3-2.
Bibliography
- Barnes, Jay (1998), Florida's Hurricane History, Chapel Hill Press, ISBN 0-8078-4748-8
External links