Adur District Council election, 2006
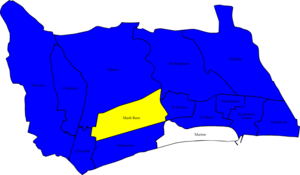
Map of the results of the 2006 Adur council election. Conservatives in blue, Liberal Democrats in yellow and Independent in white.
Elections to Adur District Council were held on 4 May 2006. Half of the council was up for election and the Conservative party held overall control of the council.
After the election, the composition of the council was
Results
| Adur Local Election Result 2006 | ||||||||||
|---|---|---|---|---|---|---|---|---|---|---|
| Party | Seats | Gains | Losses | Net gain/loss | Seats % | Votes % | Votes | +/− | ||
| Conservative | 12 | 2 | 0 | +2 | 85.7 | 49.3 | 6,813 | -2.6% | ||
| Liberal Democrat | 1 | 0 | 0 | 0 | 7.1 | 26.9 | 3,718 | +13.5% | ||
| Independent | 1 | 0 | 0 | 0 | 7.1 | 5.9 | 809 | -5.3% | ||
| Labour | 0 | 0 | 2 | -2 | 0 | 11.0 | 1,516 | -9.4% | ||
| Green | 0 | 0 | 0 | 0 | 0 | 6.9 | 955 | +4.7% | ||
2 Conservatives were unopposed.
Ward results
| Party | Candidate | Votes | % | ± | |
|---|---|---|---|---|---|
| Conservative | Gavin Ayling | uncontested | |||
| Conservative hold | Swing | ||||
| Party | Candidate | Votes | % | ± | |
|---|---|---|---|---|---|
| Conservative | Jaynie Sykes-Strudwick | 575 | 52.8 | ||
| Liberal Democrat | Martin Hesketh | 514 | 47.2 | ||
| Majority | 61 | 5.6 | |||
| Turnout | 1,089 | ||||
| Conservative hold | Swing | ||||
| Party | Candidate | Votes | % | ± | |
|---|---|---|---|---|---|
| Conservative | David Simmons | 554 | 47.3 | ||
| Labour | Kenneth Bashford | 345 | 29.4 | ||
| Liberal Democrat | Margret Bentley | 273 | 23.3 | ||
| Majority | 209 | 17.9 | |||
| Turnout | 1,172 | ||||
| Conservative gain from Labour | Swing | ||||
| Party | Candidate | Votes | % | ± | |
|---|---|---|---|---|---|
| Conservative | James Funnell | uncontested | |||
| Conservative hold | Swing | ||||
| Party | Candidate | Votes | % | ± | |
|---|---|---|---|---|---|
| Conservative | Janet Mockridge | 684 | 59.3 | ||
| Liberal Democrat | Andrew Mortimer | 250 | 21.7 | ||
| Labour | Barry Thompsom | 219 | 19.0 | ||
| Majority | 254 | 37.6 | |||
| Turnout | 1,153 | ||||
| Conservative hold | Swing | ||||
| Party | Candidate | Votes | % | ± | |
|---|---|---|---|---|---|
| Conservative | Angela Mills | 685 | 59.6 | ||
| Liberal Democrat | Moira Collins | 464 | 40.4 | ||
| Majority | 221 | 19.2 | |||
| Turnout | 2,309 | ||||
| Conservative hold | Swing | ||||
| Party | Candidate | Votes | % | ± | |
|---|---|---|---|---|---|
| Independent | Keith Fayers-Morrissey | 809 | 75.9 | ||
| Green | Vincent Tilsley | 153 | 14.4 | ||
| Liberal Democrat | Cecily Welch | 104 | 9.8 | ||
| Majority | 656 | 61.5 | |||
| Turnout | 2,076 | ||||
| Independent hold | Swing | ||||
| Party | Candidate | Votes | % | ± | |
|---|---|---|---|---|---|
| Liberal Democrat | Richard Burt | 401 | 44.5 | ||
| Conservative | Ann Bridges | 396 | 43.9 | ||
| Green | Leslie Brockhurst | 105 | 11.6 | ||
| Majority | 5 | 0.6 | |||
| Turnout | 902 | ||||
| Liberal Democrat hold | Swing | ||||
| Party | Candidate | Votes | % | ± | |
|---|---|---|---|---|---|
| Conservative | Brian Boggis | 569 | 56.3 | ||
| Liberal Democrat | Kimberley Bonnett | 287 | 28.4 | ||
| Labour | Joyce Burns | 155 | 15.3 | ||
| Majority | 282 | 27.9 | |||
| Turnout | 1,867 | ||||
| Conservative hold | Swing | ||||
| Party | Candidate | Votes | % | ± | |
|---|---|---|---|---|---|
| Conservative | Victoria Parkin | 473 | 47.2 | ||
| Green | Moyra Martin | 203 | 20.2 | ||
| Liberal Democrat | Robert King | 168 | 16.7 | ||
| Labour | Andrew Bray | 159 | 15.9 | ||
| Majority | 270 | 27.0 | |||
| Turnout | 1,003 | ||||
| Conservative hold | Swing | ||||
| Party | Candidate | Votes | % | ± | |
|---|---|---|---|---|---|
| Conservative | Neil Parkin | 767 | 57.7 | ||
| Green | Susan Board | 234 | 17.6 | ||
| Liberal Democrat | Victoria Broom-Sopp | 188 | 14.1 | ||
| Labour | Stephen Mear | 140 | 10.5 | ||
| Majority | 533 | 40.1 | |||
| Turnout | 1,329 | ||||
| Conservative hold | Swing | ||||
| Party | Candidate | Votes | % | ± | |
|---|---|---|---|---|---|
| Conservative | Carl English | 500 | 49.5 | ||
| Labour | Peter Berry | 337 | 33.3 | ||
| Liberal Democrat | John Hilditch | 174 | 17.2 | ||
| Majority | 163 | 16.2 | |||
| Turnout | 1,011 | ||||
| Conservative gain from Labour | Swing | ||||
| Party | Candidate | Votes | % | ± | |
|---|---|---|---|---|---|
| Conservative | Julie Searle | 748 | 63.0 | ||
| Liberal Democrat | Clive Connor | 278 | 23.4 | ||
| Labour | Ian Lidbetter | 161 | 13.6 | ||
| Majority | 470 | 39.6 | |||
| Turnout | 1,187 | ||||
| Conservative hold | Swing | ||||
| Party | Candidate | Votes | % | ± | |
|---|---|---|---|---|---|
| Conservative | Christine Turner | 862 | 49.6 | ||
| Liberal Democrat | Doris Martin | 617 | 35.5 | ||
| Green | Celia Behan | 260 | 15.0 | ||
| Majority | 245 | 14.1 | |||
| Turnout | 1,739 | ||||
| Conservative hold | Swing | ||||
References
| West Sussex County Council | |
|---|---|
| Adur District Council | |
| Arun District Council | |
| Chichester District Council | |
| Crawley Borough Council | |
| Horsham District Council |
|
| Mid Sussex District Council | |
| Worthing Borough Council | |
| |
This article is issued from Wikipedia - version of the 7/31/2016. The text is available under the Creative Commons Attribution/Share Alike but additional terms may apply for the media files.