Bury Metropolitan Borough Council election, 2006
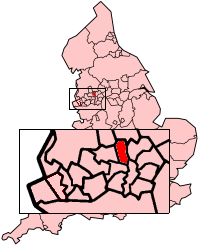
The Metropolitan Borough of Bury shown within England.
Elections to Bury Metropolitan Borough Council were held on 4 May 2006. One third of the council was up for election, and the Labour Party lost control of the council.
After the election, the composition of the council was
- Labour 23
- Conservative 22
- Liberal Democrat 6
Election result
| Bury Local Election Result 2006 | ||||||||||
|---|---|---|---|---|---|---|---|---|---|---|
| Party | Seats | Gains | Losses | Net gain/loss | Seats % | Votes % | Votes | +/− | ||
| Labour | 5 | 1 | 5 | -4 | 33.8 | 17,337 | -1.2 | |||
| Conservative | 9 | 4 | 1 | +3 | 42.2 | 21,619 | +5.2 | |||
| Liberal Democrat | 3 | 1 | 0 | +1 | 21.6 | 11,072 | -0.1 | |||
| Independent | 0 | 0 | 0 | 0 | 0 | 2.5 | 1,259 | -0.6 | ||
Ward results
| Party | Candidate | Votes | % | ± | |
|---|---|---|---|---|---|
| Labour | Ken Audin | 1,085 | 47.5 | -5.8 | |
| Conservative | Jonathan Grosskopf | 597 | 26.1 | +0.4 | |
| Liberal Democrat | Mary D'Albert | 396 | 17.3 | -3.8 | |
| Independent | Lucy Cohn | 208 | 9.1 | +9.1 | |
| Majority | 488 | 21.3 | |||
| Turnout | 2,286 | ||||
| Labour hold | Swing | ||||
| Party | Candidate | Votes | % | ± | |
|---|---|---|---|---|---|
| Conservative | Robert Bibby | 2,048 | 57.8 | +10.9 | |
| Labour | Benjamin Shatliff | 847 | 23.9 | -0.2 | |
| Liberal Democrat | Paul Jenkins | 649 | 18.3 | +3.8 | |
| Majority | 1,201 | 38.9 | |||
| Turnout | 3,544 | ||||
| Conservative hold | Swing | ||||
| Party | Candidate | Votes | % | ± | |
|---|---|---|---|---|---|
| Labour | Trevor Holt | 1,259 | 52.9 | +15.6 | |
| Conservative | Azmat Husain | 702 | 29.5 | +3.5 | |
| Liberal Democrat | Ewan Arthur | 597 | 18.6 | -6.7 | |
| Majority | 557 | 23.4 | |||
| Turnout | 2,382 | ||||
| Labour hold | Swing | ||||
| Party | Candidate | Votes | % | ± | |
|---|---|---|---|---|---|
| Conservative | Michael Hankey | 1,533 | 47.7 | +9.1 | |
| Labour | Stella Smith | 1,083 | 33.7 | -0.9 | |
| Liberal Democrat | Ewan Arthur | 597 | 18.6 | +1.9 | |
| Majority | 450 | 14.0 | |||
| Turnout | 3,213 | ||||
| Conservative gain from Labour | Swing | ||||
| Party | Candidate | Votes | % | ± | |
|---|---|---|---|---|---|
| Liberal Democrat | Tim Pickstone | 1,576 | 52.0 | -4.7 | |
| Conservative | Marilyn Vincent | 757 | 25.0 | +5.6 | |
| Labour | Suzanne Johnston | 699 | 23.1 | -0.8 | |
| Majority | 819 | 27.0 | |||
| Turnout | 3,032 | ||||
| Liberal Democrat hold | Swing | ||||
| Party | Candidate | Votes | % | ± | |
|---|---|---|---|---|---|
| Conservative | Peter Ashworth | 1,129 | 40.2 | +7.0 | |
| Labour | Warren Flood | 995 | 35.4 | -9.3 | |
| Liberal Democrat | Victor Hagan | 686 | 24.4 | +2.3 | |
| Majority | 134 | 4.8 | |||
| Turnout | 2,810 | ||||
| Conservative gain from Labour | Swing | ||||
| Party | Candidate | Votes | % | ± | |
|---|---|---|---|---|---|
| Conservative | James Taylor | 2,350 | 61.9 | +1.7 | |
| Liberal Democrat | Robert Sloss | 741 | 19.5 | +1.3 | |
| Labour | Francis Shatliff | 706 | 18.6 | -2.9 | |
| Majority | 1,609 | 42.4 | |||
| Turnout | 3,797 | ||||
| Conservative hold | Swing | ||||
| Party | Candidate | Votes | % | ± | |
|---|---|---|---|---|---|
| Conservative | Bernard Vincent | 1,760 | 61.7 | +10.1 | |
| Labour | Alan Quinn | 840 | 29.5 | -1.8 | |
| Liberal Democrat | Mohammed Mustafa | 251 | 8.8 | -8.4 | |
| Majority | 920 | 32.3 | |||
| Turnout | 2,851 | ||||
| Conservative hold | Swing | ||||
| Party | Candidate | Votes | % | ± | |
|---|---|---|---|---|---|
| Conservative | Catherine Berry | 1,029 | 38.8 | +12.7 | |
| Labour | Steve Perkins | 963 | 36.3 | -1.8 | |
| Liberal Democrat | Michael Halsall | 460 | 17.4 | -0.6 | |
| Independent | Paul Clarke | 199 | 7.5 | +7.5 | |
| Majority | 66 | 2.5 | |||
| Turnout | 2,651 | ||||
| Conservative gain from Labour | Swing | ||||
| Party | Candidate | Votes | % | ± | |
|---|---|---|---|---|---|
| Labour | Sharron Briggs | 1,431 | 42.2 | +2.0 | |
| Conservative | Stuart Penketh | 1,416 | 41.7 | +7.1 | |
| Liberal Democrat | Maureen Davison | 367 | 10.8 | -6.1 | |
| Independent | Matthew Randall | 180 | 5.3 | -3.1 | |
| Majority | 15 | 0.4 | |||
| Turnout | 3,394 | ||||
| Labour hold | Swing | ||||
| Party | Candidate | Votes | % | ± | |
|---|---|---|---|---|---|
| Labour | Wayne Campbell | 1,231 | 54.9 | +1.0 | |
| Conservative | Alan Bigg | 709 | 31.6 | +3.8 | |
| Independent | Deborah Fallon | 301 | 13.4 | +13.4 | |
| Majority | 522 | 23.3 | |||
| Turnout | 2,241 | ||||
| Labour hold | Swing | ||||
| Party | Candidate | Votes | % | ± | |
|---|---|---|---|---|---|
| Conservative | Diane Ashworth | 1,759 | 56.3 | +5.1 | |
| Labour | Valerie Robinson | 939 | 30.0 | -0.9 | |
| Liberal Democrat | Fiona Davison | 427 | 13.7 | -4.2 | |
| Majority | 820 | 26.2 | |||
| Turnout | 3,125 | ||||
| Conservative hold | Swing | ||||
| Party | Candidate | Votes | % | ± | |
|---|---|---|---|---|---|
| Labour | Farook Chaudhry | 1,178 | 37.5 | +2.7 | |
| Conservative | Khalid Hussain | 1,127 | 35.8 | +8.5 | |
| Liberal Democrat | Bill Brison | 840 | 26.7 | +3.9 | |
| Majority | 51 | 1.6 | |||
| Turnout | 3,145 | ||||
| Labour gain from Conservative | Swing | ||||
| Party | Candidate | Votes | % | ± | |
|---|---|---|---|---|---|
| Liberal Democrat | Donal O'Hanlon | 1,333 | 42.0 | +17.6 | |
| Labour | Steve Treadgold | 896 | 28.2 | -14.6 | |
| Conservative | Denise Ormrod | 727 | 22.9 | -9.9 | |
| Independent | Andrew Duff | 217 | 6.8 | +6.8 | |
| Majority | 437 | 13.8 | |||
| Turnout | 3,173 | ||||
| Liberal Democrat gain from Labour | Swing | ||||
| Party | Candidate | Votes | % | ± | |
|---|---|---|---|---|---|
| Liberal Democrat | Andrew Garner | 1,478 | 39.1 | +1.5 | |
| Labour | Peter Timperley | 1,224 | 32.4 | -1.9 | |
| Conservative | Shneur Odze | 1,075 | 28.5 | +0.5 | |
| Majority | 254 | 6.7 | |||
| Turnout | 3,777 | ||||
| Liberal Democrat hold | Swing | ||||
| Party | Candidate | Votes | % | ± | |
|---|---|---|---|---|---|
| Conservative | Iain Garside | 1,590 | 57.2 | +13.9 | |
| Labour | Jane Lewis | 711 | 25.6 | -1.2 | |
| Liberal Democrat | David Foss | 478 | 17.2 | +3.2 | |
| Majority | 879 | 31.6 | |||
| Turnout | 2,779 | ||||
| Conservative hold | Swing | ||||
| Party | Candidate | Votes | % | ± | |
|---|---|---|---|---|---|
| Conservative | Beverley Sullivan | 1,311 | 42.5 | +2.5 | |
| Labour | Joan Grimshaw | 1,250 | 40.5 | +1.1 | |
| Liberal Democrat | Geoffrey Young | 372 | 12.1 | -0.9 | |
| Independent | Paul Gerrard | 154 | 5.0 | -2.6 | |
| Majority | 61 | 2.0 | |||
| Turnout | 3,087 | ||||
| Conservative gain from Labour | Swing | ||||
References
| Mayor | |
|---|---|
| Bolton | |
| Bury | |
| Manchester | |
| Oldham | |
| Rochdale | |
| Salford | |
| Stockport | |
| Tameside | |
| Trafford | |
| Wigan | |
| County Council |
|
| |
This article is issued from Wikipedia - version of the 10/4/2015. The text is available under the Creative Commons Attribution/Share Alike but additional terms may apply for the media files.