United Kingdom local elections, 2005
United Kingdom local elections, 2005
|
|
|
|
All 34 non-metropolitan counties, 3 out of 46 unitary authorities,
1 sui generis authority, 4 directly elected mayors
and all 26 Northern Irish districts |
| |
Majority party |
Minority party |
Third party |
| |
 |
 |
.jpg) |
| Leader |
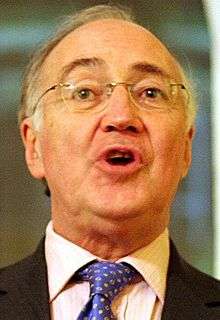
Michael Howard |
Tony Blair |
Charles Kennedy |
| Party |
Conservative |
Labour |
Liberal Democrat |
| Leader since |
6 November 2003 |
21 July 1994 |
9 August 1999 |
| Last election |
37% |
30% |
21% |
| Percentage |
40% |
28% |
25% |
| Swing |
 3% 3% |
 2% 2% |
4% |
| Councils |
24 |
6 |
3 |
| Councils +/- |
7 |
1 |
3 |
| Councillors |
1193 |
612 |
493 |
| Councillors +/- |
152 |
114 |
40 |
|
|
Elections for local government were held in the England and Northern Ireland on 5 May 2005 along with the 2005 general election across the entire United Kingdom. In addition, the Isle of Wight held a local referendum on the issue of a directly elected mayor.
Despite losing the general election held on the same day, the Conservatives made strong gains at Labour's expense, providing some comfort to the party. Conservative leader Michael Howard resigned soon afterwards and was succeeded by David Cameron, who had a decent platform to build on in his challenge to lead the Conservatives to a general election victory; the party had increased its share of council seats and importantly its share of seats in parliament.
Summary of results
Source: BBC local election results for England[1]
England
Non-metropolitan county councils
In 34 shire county county council, all seats were up for re-election.
‡ New electoral division boundaries
Unitary authorities
Whole council
In two unitary authorities the whole council were up for election and one had a third of the council up for election.
‡ New ward boundaries
Third of council
Sui generis
Mayoral elections
Four direct mayoral elections were held.
Northern Ireland
All seats were up for election in the 26 districts of Northern Ireland. The many parties and the use of the single transferable vote meant that most councils ended up in no overall control.
The DUP gained majority control of three councils: Ards, Ballymena, and Castlereagh.
Results summary
| Party |
Councillors |
Votes |
| Change |
Total |
% share |
Total |
|
DUP |
+51 |
182 |
30 |
208,278 |
|
Sinn Féin |
+18 |
126 |
23 |
163,205 |
|
UUP |
-39 |
115 |
18 |
126,317 |
|
SDLP |
-16 |
101 |
17 |
121,991 |
|
Alliance |
+2 |
30 |
5 |
35,149 |
|
Independent |
-14 |
20 |
4 |
27,677 |
|
Green (NI) |
+3 |
3 |
1 |
5,703 |
|
PUP |
-2 |
2 |
1 |
4,591 |
|
United Unionist |
0 |
2 |
0.3 |
2,064 |
|
Newtownabbey Ratepayers |
0 |
1 |
0.3 |
1,897 |
|
Socialist Environmental |
0 |
0 |
0.2 |
1,321 |
|
NI Conservatives |
0 |
0 |
0.2 |
1,164 |
|
Workers' Party |
0 |
0 |
0.1 |
1,052 |
|
Socialist Party |
0 |
0 |
0.1 |
828 |
|
NI Women's Coalition |
-1 |
0 |
0.1 |
738 |
|
UK Unionist |
-2 |
0 |
0.1 |
734 |
Council Control
Source: ARK research and knowledge group[2]
References