Ashford Borough Council election, 2003
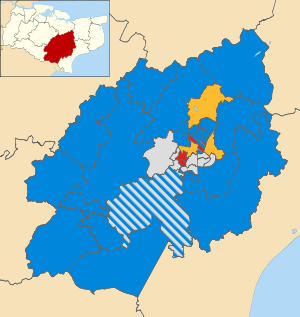
Map of the results of the 2003 Ashford council election. Conservatives in blue, Independents in grey, Liberal Democrats in yellow and Labour in red.
Elections to Ashford Borough Council were held on 1 May 2003. The whole council was up for election with boundary changes since the last election in 1999 reducing the number of seats by 6. The Conservative party gained control of the council from no overall control.
Election result
| Ashford Local Election Result 2003 | ||||||||||
|---|---|---|---|---|---|---|---|---|---|---|
| Party | Seats | Gains | Losses | Net gain/loss | Seats % | Votes % | Votes | +/− | ||
| Conservative | 25 | +2 | 58.1 | 48.7 | 17,689 | |||||
| Independent | 9 | 0 | 20.9 | 15.2 | 5,534 | |||||
| Liberal Democrat | 5 | -2 | 11.6 | 19.4 | 7,048 | |||||
| Labour | 4 | -6 | 9.3 | 14.8 | 5,366 | |||||
| Green | 0 | 0 | 0 | 1.5 | 562 | |||||
| National Front | 0 | 0 | 0 | 0.3 | 98 | |||||
Ward results
| Party | Candidate | Votes | % | ± | |
|---|---|---|---|---|---|
| Independent | Robert Enock | 168 | 33.5 | ||
| Labour | Martin Allcock | 133 | 26.5 | ||
| Liberal Democrat | Rodney Norris | 98 | 19.5 | ||
| Conservative | James Holtum | 52 | 10.4 | ||
| National Front | John Kellam | 51 | 10.2 | ||
| Majority | 35 | 7.0 | |||
| Turnout | 502 | 26.3 | |||
| Party | Candidate | Votes | % | ± | |
|---|---|---|---|---|---|
| Labour | Alan Allcock | 636 | |||
| Labour | Allen Wells | 619 | |||
| Conservative | Gillian Taylor-Lowen | 261 | |||
| Conservative | Janet Rymer-Jones | 259 | |||
| Turnout | 1,775 | 24.3 | |||
| Party | Candidate | Votes | % | ± | |
|---|---|---|---|---|---|
| Conservative | Neil Bell | 507 | 77.5 | ||
| Liberal Democrat | William Platt | 147 | 22.5 | ||
| Majority | 360 | 55.0 | |||
| Turnout | 654 | 34.2 | |||
| Party | Candidate | Votes | % | ± | |
|---|---|---|---|---|---|
| Conservative | Noel Greaves | 350 | 59.8 | ||
| Labour | Simon Storer | 235 | 40.2 | ||
| Majority | 115 | 19.6 | |||
| Turnout | 585 | 32.2 | |||
| Party | Candidate | Votes | % | ± | |
|---|---|---|---|---|---|
| Liberal Democrat | Rita Hawes | 391 | 71.6 | ||
| Conservative | Stephen Killick | 155 | 28.4 | ||
| Majority | 236 | 43.2 | |||
| Turnout | 546 | 29.9 | |||
| Party | Candidate | Votes | % | ± | |
|---|---|---|---|---|---|
| Conservative | Marlon Martin | 381 | 62.8 | ||
| Labour | Madhanagopal Permall | 226 | 37.2 | ||
| Majority | 155 | 25.6 | |||
| Turnout | 607 | 31.6 | |||
| Party | Candidate | Votes | % | ± | |
|---|---|---|---|---|---|
| Conservative | Douglas Gillard | 443 | 67.4 | ||
| Liberal Democrat | Leonard Micklewright | 214 | 32.6 | ||
| Majority | 229 | 34.8 | |||
| Turnout | 657 | 25.4 | |||
| Party | Candidate | Votes | % | ± | |
|---|---|---|---|---|---|
| Conservative | Jane Marriott | 599 | 79.1 | ||
| Liberal Democrat | Myrtle Butcher | 158 | 20.9 | ||
| Majority | 441 | 58.2 | |||
| Turnout | 757 | 39.6 | |||
| Party | Candidate | Votes | % | ± | |
|---|---|---|---|---|---|
| Conservative | Neil Wallace | 412 | 56.9 | ||
| Liberal Democrat | John Hawes | 242 | 33.4 | ||
| Labour | Valerie Horton | 70 | 9.7 | ||
| Majority | 170 | 23.5 | |||
| Turnout | 724 | 38.2 | |||
| Party | Candidate | Votes | % | ± | |
|---|---|---|---|---|---|
| Conservative | Peter Feacey | 463 | |||
| Conservative | Bernard Heyes | 406 | |||
| Labour | Ivor Groves | 209 | |||
| Labour | Doreen Topley | 193 | |||
| Liberal Democrat | Patricia Packham | 175 | |||
| Green | Pauline Fillery | 105 | |||
| Green | Lola Sansom | 49 | |||
| Turnout | 1,600 | 28.6 | |||
| Party | Candidate | Votes | % | ± | |
|---|---|---|---|---|---|
| Independent | Antony Maltby | 298 | 56.5 | ||
| Conservative | Charles Campbell | 189 | 35.9 | ||
| Liberal Democrat | Claire Yeo | 40 | 7.6 | ||
| Majority | 109 | 20.6 | |||
| Turnout | 527 | 40.4 | |||
| Party | Candidate | Votes | % | ± | |
|---|---|---|---|---|---|
| Independent | Maureen Larkin | 299 | 47.2 | ||
| Liberal Democrat | Julian Norris | 168 | 26.5 | ||
| Conservative | James Coultrip | 167 | 26.3 | ||
| Majority | 131 | 20.7 | |||
| Turnout | 634 | 32.7 | |||
| Party | Candidate | Votes | % | ± | |
|---|---|---|---|---|---|
| Conservative | Michael Burgess | 596 | 66.7 | ||
| Liberal Democrat | Barry Wright | 189 | 21.1 | ||
| Labour | Katherine Manning | 109 | 12.2 | ||
| Majority | 407 | 45.6 | |||
| Turnout | 894 | 43.5 | |||
| Party | Candidate | Votes | % | ± | |
|---|---|---|---|---|---|
| Conservative | John Kemp | 465 | 71.4 | ||
| Liberal Democrat | Robert Rawlings | 186 | 28.6 | ||
| Majority | 279 | 42.8 | |||
| Turnout | 651 | 36.2 | |||
| Party | Candidate | Votes | % | ± | |
|---|---|---|---|---|---|
| Conservative | Norman Ayres | 405 | 67.2 | ||
| Liberal Democrat | Anthony Hardwick | 118 | 19.6 | ||
| Labour | Muhammed Khan | 80 | 13.3 | ||
| Majority | 287 | 47.6 | |||
| Turnout | 603 | 33.0 | |||
| Party | Candidate | Votes | % | ± | |
|---|---|---|---|---|---|
| Independent | Melvyn Elliff | 223 | 35.7 | ||
| Liberal Democrat | Barbara Simmons | 184 | 29.4 | ||
| Labour | Leslie Lawrie | 146 | 23.3 | ||
| Conservative | Louis Parsons | 72 | 11.5 | ||
| Majority | 39 | 6.3 | |||
| Turnout | 625 | 31.4 | |||
| Party | Candidate | Votes | % | ± | |
|---|---|---|---|---|---|
| Liberal Democrat | Serge Koowaree | 584 | |||
| Liberal Democrat | Robert Davidson | 558 | |||
| Independent | Robert Stubbs | 374 | |||
| Conservative | Stephen Cochrane | 364 | |||
| Independent | Margaret Pryke | 337 | |||
| Conservative | Douglas Marriott | 294 | |||
| Labour | Matthew Kirk | 135 | |||
| Turnout | 2,646 | 36.4 | |||
| Party | Candidate | Votes | % | ± | |
|---|---|---|---|---|---|
| Independent | Reginald Harrington | 398 | 67.1 | ||
| Conservative | William Walker | 153 | 25.8 | ||
| Liberal Democrat | David Hilliger | 42 | 7.1 | ||
| Majority | 245 | 41.3 | |||
| Turnout | 593 | 27.2 | |||
| Party | Candidate | Votes | % | ± | |
|---|---|---|---|---|---|
| Conservative | James Wedgbury | 244 | 61.8 | ||
| Independent | Aline Hicks | 151 | 38.2 | ||
| Majority | 93 | 23.6 | |||
| Turnout | 395 | 27.9 | |||
| Party | Candidate | Votes | % | ± | |
|---|---|---|---|---|---|
| Conservative | Jill Hutchinson | 645 | 77.0 | ||
| Liberal Democrat | Marion Murray | 111 | 13.2 | ||
| Labour | James Knight | 82 | 9.8 | ||
| Majority | 534 | 63.8 | |||
| Turnout | 838 | 43.0 | |||
| Party | Candidate | Votes | % | ± | |
|---|---|---|---|---|---|
| Conservative | Peter Wood | 989 | |||
| Conservative | Bruce Claridge | 947 | |||
| Independent | Jack Woodford | 395 | |||
| Liberal Democrat | Emily Nighbour | 377 | |||
| Liberal Democrat | Robin Fletcher | 302 | |||
| Turnout | 3,010 | 43.6 | |||
| Party | Candidate | Votes | % | ± | |
|---|---|---|---|---|---|
| Independent | Carol Brunger | 191 | 38.6 | ||
| Conservative | Clair Bell | 175 | 35.4 | ||
| Labour | Stephen Williams | 129 | 26.1 | ||
| Majority | 16 | 3.2 | |||
| Turnout | 495 | 27.3 | |||
| Party | Candidate | Votes | % | ± | |
|---|---|---|---|---|---|
| Independent | Malcolm Eke | 327 | 68.6 | ||
| Liberal Democrat | Jennifer Blackman | 105 | 22.0 | ||
| Conservative | Charles Vavasour | 45 | 9.4 | ||
| Majority | 222 | 46.6 | |||
| Turnout | 477 | 30.8 | |||
| Party | Candidate | Votes | % | ± | |
|---|---|---|---|---|---|
| Conservative | John Link | 534 | 80.4 | ||
| Liberal Democrat | Oliver Dove | 130 | 19.6 | ||
| Majority | 404 | 60.8 | |||
| Turnout | 664 | 34.6 | |||
| Party | Candidate | Votes | % | ± | |
|---|---|---|---|---|---|
| Labour | Harriet Yeo | 173 | 46.0 | ||
| Liberal Democrat | Victoria Macdonald | 103 | 27.4 | ||
| Conservative | John Smith | 53 | 14.1 | ||
| National Front | Terry Blackham | 47 | 12.5 | ||
| Majority | 70 | 18.6 | |||
| Turnout | 376 | 18.7 | |||
| Party | Candidate | Votes | % | ± | |
|---|---|---|---|---|---|
| Labour | Michael Hubert | 458 | |||
| Conservative | Matthew French | 414 | |||
| Labour | Walter Davies | 406 | |||
| Conservative | Christopher Main | 402 | |||
| Liberal Democrat | Jacqueline Smith | 312 | |||
| Liberal Democrat | Stephen Smith | 233 | |||
| Turnout | 2,225 | 30.2 | |||
| Party | Candidate | Votes | % | ± | |
|---|---|---|---|---|---|
| Conservative | Paul Clokie | 466 | 66.9 | ||
| Liberal Democrat | Stuart Dove | 231 | 33.1 | ||
| Majority | 235 | 33.8 | |||
| Turnout | 697 | 38.7 | |||
| Party | Candidate | Votes | % | ± | |
|---|---|---|---|---|---|
| Conservative | Peter Goddard | 411 | 66.1 | ||
| Liberal Democrat | Patricia Rickwood | 124 | 19.9 | ||
| Labour | Michael Kirk | 87 | 14.0 | ||
| Majority | 287 | 46.2 | |||
| Turnout | 622 | 35.0 | |||
| Party | Candidate | Votes | % | ± | |
|---|---|---|---|---|---|
| Liberal Democrat | Robert Packham | 342 | |||
| Liberal Democrat | Robert Cowley | 333 | |||
| Labour | Derek Madgett | 324 | |||
| Labour | Brendan Naughton | 320 | |||
| Conservative | Michael Rice | 198 | |||
| Conservative | Carmela Kegos | 190 | |||
| Green | Hazel Dawe | 96 | |||
| Green | Sharon Harvey | 60 | |||
| Turnout | 1,863 | 25.7 | |||
| Party | Candidate | Votes | % | ± | |
|---|---|---|---|---|---|
| Independent | John Holland | 164 | 34.5 | ||
| Conservative | Antonia Missions | 159 | 33.4 | ||
| Labour | Campbell Miller | 153 | 32.1 | ||
| Majority | 5 | 1.1 | |||
| Turnout | 476 | 27.5 | |||
| Party | Candidate | Votes | % | ± | |
|---|---|---|---|---|---|
| Conservative | Robert Taylor | 975 | |||
| Conservative | Mark Wickham | 930 | |||
| Independent | Keith Brannan | 563 | |||
| Liberal Democrat | Jonathan Heuch | 308 | |||
| Labour | John Moriarty | 184 | |||
| Turnout | 2,960 | 39.7 | |||
| Party | Candidate | Votes | % | ± | |
|---|---|---|---|---|---|
| Conservative | Paul Bartlett | 357 | 57.5 | ||
| Independent | Michael Ciccone | 264 | 42.5 | ||
| Majority | 93 | 15.0 | |||
| Turnout | 621 | 41.4 | |||
| Party | Candidate | Votes | % | ± | |
|---|---|---|---|---|---|
| Conservative | Rita Kelly | 538 | 58.0 | ||
| Liberal Democrat | Clare Hardwick | 225 | 24.2 | ||
| Independent | Derek Swann | 165 | 17.8 | ||
| Majority | 313 | 33.8 | |||
| Turnout | 928 | 49.6 | |||
| Party | Candidate | Votes | % | ± | |
|---|---|---|---|---|---|
| Conservative | George Weller | 900 | |||
| Independent | Peter Davison | 858 | |||
| Conservative | Michael Lancaster | 706 | |||
| Independent | Edward Relf | 359 | |||
| Liberal Democrat | Rosemary Davies | 261 | |||
| Labour | Gemma Carter | 259 | |||
| Turnout | 3,343 | 45.2 | |||
| Party | Candidate | Votes | % | ± | |
|---|---|---|---|---|---|
| Conservative | Ian Cooling | 470 | 60.3 | ||
| Green | Steven Dawe | 252 | 32.3 | ||
| Liberal Democrat | Nicholas Fawcett | 57 | 7.3 | ||
| Majority | 218 | 28.0 | |||
| Turnout | 779 | 43.6 | |||
External links
| Kent County Council | |
|---|---|
| Ashford Borough Council | |
| Canterbury City Council |
|
| Dartford Borough Council | |
| Dover District Council | |
| Gravesham Borough Council | |
| Maidstone Borough Council | |
| Medway Council | |
| Sevenoaks District Council |
|
| Shepway District Council | |
| Swale Borough Council | |
| Thanet District Council | |
| Tonbridge & Malling Borough Council | |
| Tunbridge Wells Borough Council | |
| Rochester-upon-Medway City Council |
|
| Gillingham Borough Council |
|
| |
| Metropolitan boroughs |
|
|---|---|
| Unitary authorities |
|
| District councils (England) |
|
| Scottish councils |
|
| National Assembly elections | |
This article is issued from Wikipedia - version of the 11/29/2015. The text is available under the Creative Commons Attribution/Share Alike but additional terms may apply for the media files.