Harlow District Council election, 2003
The 2003 Harlow District Council election took place on 1 May 2003 to elect members of Harlow District Council in Essex, England. One third of the council was up for election and the council stayed under no overall control.[1]
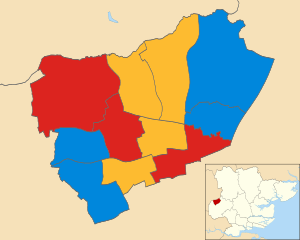
After the election, the composition of the council was
- Conservative 12
- Liberal Democrats 12
- Labour 9[2]
Background
Before the election both the Conservatives and Liberal Democrats had 12 councillors, while Labour had 9 seats.[3]
A total of 36 candidates stood for the 11 seats that were being contested, with the councillors who got the lowest number of votes from the 2002 election defending their seats.[3] One Labour councillor, John Cave, stood down at the election after 32 years, while 3 former Labour councillors and 1 former Liberal Democrat councillor attempted to regain seats.[3] Among the councillors defending their seats was the Conservative group leader Andrew Johnson in Sumners and Kingsmoor ward.[3]
Election result
There was no change in the party situation on the council with no party gaining a majority.[4] The closest result was in Bush Fair ward where Liberal Democrat Chris Millington held the seat by 39 votes, but the Liberal Democrat council chairman Nick Macy was not re-elected after contesting the Labour held seat in Little Parndon and Hare Street.[5] Overall turnout at the election was 29%.[6]
However an enquiry was started after the election as 3,279 postal votes had to be rejected as they did not have an official mark on them.[7]
| Harlow local election result 2003[2][6] | ||||||||||
|---|---|---|---|---|---|---|---|---|---|---|
| Party | Seats | Gains | Losses | Net gain/loss | Seats % | Votes % | Votes | +/− | ||
| Conservative | 4 | 0 | 0 | 0 | 36.4 | 32.7 | 4,610 | +0.9% | ||
| Liberal Democrat | 4 | 0 | 0 | 0 | 36.4 | 27.8 | 3,915 | -1.9% | ||
| Labour | 3 | 0 | 0 | 0 | 27.3 | 38.3 | 5,394 | +0.6% | ||
| Socialist Alliance | 0 | 0 | 0 | 0 | 0 | 1.3 | 181 | +0.7% | ||
Ward results
| Party | Candidate | Votes | % | ± | |
|---|---|---|---|---|---|
| Liberal Democrat | Christopher Millington | 663 | 46.5 | ||
| Labour | Terence Brandon | 624 | 43.7 | ||
| Conservative | Hazel Beckers | 140 | 9.8 | ||
| Majority | 39 | 2.8 | |||
| Turnout | 1,427 | 31.3 | -9 | ||
| Liberal Democrat hold | Swing | ||||
| Party | Candidate | Votes | % | ± | |
|---|---|---|---|---|---|
| Conservative | Anthony Hall | 705 | 68.2 | ||
| Liberal Democrat | Molly White | 179 | 17.3 | ||
| Labour | Tina Baker | 150 | 14.5 | ||
| Majority | 526 | 50.9 | |||
| Turnout | 1,034 | 22.5 | -5 | ||
| Conservative hold | Swing | ||||
| Party | Candidate | Votes | % | ± | |
|---|---|---|---|---|---|
| Conservative | Patrick McClarnon | 706 | 49.3 | ||
| Labour | Suzanne Ennifer | 514 | 35.9 | ||
| Liberal Democrat | Peter Barton | 211 | 14.7 | ||
| Majority | 192 | 13.4 | |||
| Turnout | 1,431 | 30.9 | -5 | ||
| Conservative hold | Swing | ||||
| Party | Candidate | Votes | % | ± | |
|---|---|---|---|---|---|
| Labour | Mark Wilkinson | 725 | 54.5 | ||
| Conservative | Nora Arnott | 405 | 30.4 | ||
| Liberal Democrat | Audrey Curran | 201 | 15.1 | ||
| Majority | 320 | 24.1 | |||
| Turnout | 1,331 | 29.1 | -10 | ||
| Labour hold | Swing | ||||
| Party | Candidate | Votes | % | ± | |
|---|---|---|---|---|---|
| Labour | Valerie Clark | 707 | 49.2 | ||
| Liberal Democrat | Nicholas Macy | 372 | 25.9 | ||
| Conservative | John Goddard | 293 | 20.4 | ||
| Socialist Alliance | John Hobbs | 66 | 4.6 | ||
| Majority | 335 | 23.3 | |||
| Turnout | 1,438 | 31.0 | -3 | ||
| Labour hold | Swing | ||||
| Party | Candidate | Votes | % | ± | |
|---|---|---|---|---|---|
| Liberal Democrat | Lesley Rideout | 598 | 44.8 | ||
| Labour | Sean Folan | 510 | 38.2 | ||
| Conservative | Callum Finlayson | 179 | 13.4 | ||
| Socialist Alliance | Robert Delbridge | 48 | 3.6 | ||
| Majority | 88 | 6.6 | |||
| Turnout | 1,335 | 33.6 | -8.9 | ||
| Liberal Democrat hold | Swing | ||||
| Party | Candidate | Votes | % | ± | |
|---|---|---|---|---|---|
| Liberal Democrat | James Pailing | 622 | 49.8 | ||
| Labour | Feroz Khan | 406 | 32.5 | ||
| Conservative | Matthew Warren | 153 | 12.3 | ||
| Socialist Alliance | Josephine Clarke | 67 | 5.4 | ||
| Majority | 216 | 17.3 | |||
| Turnout | 1,248 | 29.2 | -8.3 | ||
| Liberal Democrat hold | Swing | ||||
| Party | Candidate | Votes | % | ± | |
|---|---|---|---|---|---|
| Conservative | Sue Livings | 809 | 56.3 | ||
| Labour | Robert Eschle | 430 | 29.9 | ||
| Liberal Democrat | Simon MacNeill | 198 | 13.8 | ||
| Majority | 379 | 26.4 | |||
| Turnout | 1,437 | 34.5 | -6 | ||
| Conservative hold | Swing | ||||
| Party | Candidate | Votes | % | ± | |
|---|---|---|---|---|---|
| Liberal Democrat | Michael Faccini | 519 | 55.2 | ||
| Labour | Sandra Rootsey | 246 | 26.2 | ||
| Conservative | Shona Souter | 175 | 18.6 | ||
| Majority | 273 | 29.0 | |||
| Turnout | 940 | 22.7 | -5 | ||
| Liberal Democrat hold | Swing | ||||
| Party | Candidate | Votes | % | ± | |
|---|---|---|---|---|---|
| Conservative | Andrew Johnson | 572 | 48.2 | ||
| Labour | Derek Eardley | 452 | 38.1 | ||
| Liberal Democrat | Peter Mabey | 163 | 13.7 | ||
| Majority | 120 | 10.1 | |||
| Turnout | 1,187 | 25.4 | -5 | ||
| Conservative hold | Swing | ||||
| Party | Candidate | Votes | % | ± | |
|---|---|---|---|---|---|
| Labour | Robert Davis | 630 | 48.8 | ||
| Conservative | Muriel Jolles | 473 | 36.6 | ||
| Liberal Democrat | Paul Lawton | 189 | 14.6 | ||
| Majority | 157 | 12.2 | |||
| Turnout | 1,292 | 29.6 | -6 | ||
| Labour hold | Swing | ||||
References
- ↑ "Local elections". BBC News Online. Retrieved 31 December 2014.
- 1 2 "English councils - Non-metropolitan districts". The Times. NewsBank. 3 May 2003. p. 47.
- 1 2 3 4 "Citizen election news". Greater London, Kent, and Surrey Counties Publications. NewsBank. 7 April 2003.
- ↑ "Essex: Tories make gains in local elections". Essex County Publications. NewsBank. 2 May 2003.
- ↑ "Election reaction". Hertfordshire County Publications. NewsBank. 7 May 2003.
- 1 2 3 4 5 6 7 8 9 10 11 12 13 "Election results". Harlow District Council. Political Science Resources. Retrieved 31 December 2014.
- ↑ "Ballot blunder probed". Greater London, Kent, and Surrey Counties Publications. NewsBank. 7 May 2003.
| Metropolitan boroughs |
|
|---|---|
| Unitary authorities |
|
| District councils (England) |
|
| Scottish councils |
|
| National Assembly elections | |