East Hampshire District Council election, 2003
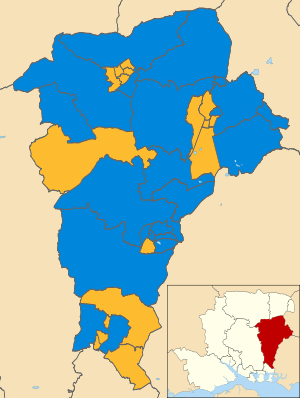
Map of the results of the 2003 East Hampshire council election. Conservatives in blue and Liberal Democrats in yellow.
The 2003 East Hampshire District Council election took place on 1 May 2003 to elect members of East Hampshire District Council in Hampshire England. The whole council was up for election with boundary changes since the last election in 1999 increasing the number of seats by 2.[1] The Conservative party stayed in overall control of the council.[2]
Election result
| East Hampshire Local Election Result 2003[3][2] | ||||||||||
|---|---|---|---|---|---|---|---|---|---|---|
| Party | Seats | Gains | Losses | Net gain/loss | Seats % | Votes % | Votes | +/− | ||
| Conservative | 26 | +4 | 59.1 | 53.5 | 18,866 | |||||
| Liberal Democrat | 18 | +1 | 40.9 | 41.0 | 14,450 | |||||
| Labour | 0 | 0 | 0 | 4.4 | 1,537 | |||||
| Independent | 0 | -3 | 0 | 0.8 | 273 | |||||
| Green | 0 | 0 | 0 | 0.3 | 114 | |||||
3 Conservative and 1 Liberal Democrat candidates were unooposed at the election.[3]
Ward results
| Party | Candidate | Votes | % | ± | |
|---|---|---|---|---|---|
| Liberal Democrat | Anthony Ludlow | 333 | 56.6 | ||
| Conservative | Camilla Boreham | 161 | 27.4 | ||
| Labour | Roger Godber | 94 | 16.0 | ||
| Majority | 172 | 29.3 | |||
| Turnout | 588 | 31.1 | |||
| Party | Candidate | Votes | % | ± | |
|---|---|---|---|---|---|
| Conservative | Robert Chilton | 351 | 52.9 | ||
| Liberal Democrat | James McKell | 312 | 47.1 | ||
| Majority | 39 | 5.9 | |||
| Turnout | 663 | 38.0 | |||
| Party | Candidate | Votes | % | ± | |
|---|---|---|---|---|---|
| Liberal Democrat | Pamela Bradford | 289 | 58.4 | ||
| Conservative | Christopher Butler | 122 | 24.6 | ||
| Labour | Janice Treacher | 84 | 17.0 | ||
| Majority | 167 | 33.7 | |||
| Turnout | 495 | 24.4 | |||
| Party | Candidate | Votes | % | ± | |
|---|---|---|---|---|---|
| Liberal Democrat | Robert Booker | 449 | 70.2 | ||
| Conservative | Michael Baker | 191 | 29.8 | ||
| Majority | 258 | 40.3 | |||
| Turnout | 640 | 30.5 | |||
| Party | Candidate | Votes | % | ± | |
|---|---|---|---|---|---|
| Liberal Democrat | Allan Chick | 397 | 50.9 | ||
| Conservative | Charles Glasgow | 383 | 49.1 | ||
| Majority | 14 | 1.8 | |||
| Turnout | 780 | 41.6 | |||
| Party | Candidate | Votes | % | ± | |
|---|---|---|---|---|---|
| Liberal Democrat | Jeremy Janes | 257 | 52.9 | ||
| Conservative | Christopher Jones | 121 | 24.9 | ||
| Labour | Barbara Burfoot | 108 | 22.2 | ||
| Majority | 136 | 28.0 | |||
| Turnout | 486 | 27.1 | |||
| Party | Candidate | Votes | % | ± | |
|---|---|---|---|---|---|
| Conservative | Brian Dickinson | unopposed | |||
| Party | Candidate | Votes | % | ± | |
|---|---|---|---|---|---|
| Conservative | Anna James | 1,130 | |||
| Conservative | Simon James | 1,110 | |||
| Conservative | Evelyn Hope | 1,017 | |||
| Liberal Democrat | Patricia Clarke | 594 | |||
| Liberal Democrat | James Walters | 587 | |||
| Liberal Democrat | Mary Walters | 492 | |||
| Labour | Peter Dare | 197 | |||
| Independent | Frederick Dawkins | 141 | |||
| Turnout | 5,268 | 28.1 | |||
| Party | Candidate | Votes | % | ± | |
|---|---|---|---|---|---|
| Liberal Democrat | Elizabeth Murray | 700 | 34.9 | ||
| Liberal Democrat | Peter Rodgers | 700 | 34.9 | ||
| Conservative | Kenneth Moon | 605 | 30.2 | ||
| Turnout | 2,005 | 31.9 | |||
| Party | Candidate | Votes | % | ± | |
|---|---|---|---|---|---|
| Conservative | Patrick Burridge | 532 | 71.5 | ||
| Liberal Democrat | Atul Patel | 212 | 28.5 | ||
| Majority | 320 | 43.0 | |||
| Turnout | 744 | 40.1 | |||
| Party | Candidate | Votes | % | ± | |
|---|---|---|---|---|---|
| Conservative | Marjorie Day | unopposed | |||
| Party | Candidate | Votes | % | ± | |
|---|---|---|---|---|---|
| Conservative | Maurice Johnson | 1,013 | |||
| Conservative | Patricia Seward | 962 | |||
| Liberal Democrat | Brian Timms | 952 | |||
| Liberal Democrat | David Harrison | 749 | |||
| Labour | Peter Treacher | 129 | |||
| Turnout | 3,805 | 45.0 | |||
| Party | Candidate | Votes | % | ± | |
|---|---|---|---|---|---|
| Conservative | Jennifer Gray | 503 | 63.8 | ||
| Liberal Democrat | Albert Perry | 285 | 36.2 | ||
| Majority | 218 | 27.7 | |||
| Turnout | 788 | 41.2 | |||
| Party | Candidate | Votes | % | ± | |
|---|---|---|---|---|---|
| Conservative | Ferris Cowper | 647 | 85.0 | ||
| Green | Clive Albone | 114 | 15.0 | ||
| Majority | 533 | 70.0 | |||
| Turnout | 761 | 39.5 | |||
| Party | Candidate | Votes | % | ± | |
|---|---|---|---|---|---|
| Conservative | Geoffrey Whittle | 992 | |||
| Conservative | Anthony Williams | 970 | |||
| Liberal Democrat | Sheila Drury | 342 | |||
| Liberal Democrat | Moira Watkinson | 292 | |||
| Labour | Mark Walsh | 133 | |||
| Turnout | 2,729 | 31.0 | |||
| Party | Candidate | Votes | % | ± | |
|---|---|---|---|---|---|
| Conservative | David O'Donnell | 511 | 54.9 | ||
| Liberal Democrat | Robert Saunders | 211 | 22.7 | ||
| Independent | Brian Nonhebel | 132 | 14.2 | ||
| Labour | Donald Hammond | 76 | 8.2 | ||
| Majority | 300 | 32.3 | |||
| Turnout | 930 | 41.8 | |||
| Party | Candidate | Votes | % | ± | |
|---|---|---|---|---|---|
| Conservative | Sara Schillemore | 356 | 57.3 | ||
| Liberal Democrat | Alan Ramsay | 265 | 42.7 | ||
| Majority | 91 | 14.7 | |||
| Turnout | 621 | 33.6 | |||
| Party | Candidate | Votes | % | ± | |
|---|---|---|---|---|---|
| Liberal Democrat | Thomas Costello | 454 | 66.9 | ||
| Conservative | John Munro | 225 | 33.1 | ||
| Majority | 229 | 33.7 | |||
| Turnout | 679 | 34.5 | |||
| Party | Candidate | Votes | % | ± | |
|---|---|---|---|---|---|
| Conservative | Dorothy Denston | 432 | 73.6 | ||
| Liberal Democrat | Elaine Woodard | 155 | 26.4 | ||
| Majority | 277 | 47.2 | |||
| Turnout | 587 | 29.9 | |||
| Party | Candidate | Votes | % | ± | |
|---|---|---|---|---|---|
| Liberal Democrat | Kenneth Graham | unopposed | |||
| Party | Candidate | Votes | % | ± | |
|---|---|---|---|---|---|
| Liberal Democrat | Michael Ashton | 345 | 67.6 | ||
| Conservative | Hilary Munro | 165 | 32.4 | ||
| Majority | 180 | 35.3 | |||
| Turnout | 510 | 27.0 | |||
| Party | Candidate | Votes | % | ± | |
|---|---|---|---|---|---|
| Conservative | Yvonne Parker Smith | 349 | 68.2 | ||
| Liberal Democrat | Anthony Muldoon | 163 | 31.8 | ||
| Majority | 186 | 36.3 | |||
| Turnout | 512 | 29.3 | |||
| Party | Candidate | Votes | % | ± | |
|---|---|---|---|---|---|
| Conservative | Elizabeth Cartwright | 1,114 | |||
| Conservative | David Onslow | 802 | |||
| Liberal Democrat | Roger Mullenger | 644 | |||
| Labour | Howard Linsley | 284 | |||
| Turnout | 2,844 | 38.0 | |||
| Party | Candidate | Votes | % | ± | |
|---|---|---|---|---|---|
| Conservative | Guy Stacpoole | 250 | 44.4 | ||
| Liberal Democrat | Penelope Wright | 210 | 37.3 | ||
| Labour | Alan Stephens | 103 | 18.3 | ||
| Majority | 40 | 7.1 | |||
| Turnout | 563 | 31.7 | |||
| Party | Candidate | Votes | % | ± | |
|---|---|---|---|---|---|
| Liberal Democrat | Anne Claxton | 342 | 50.0 | ||
| Conservative | Kerry Dedman | 272 | 39.8 | ||
| Labour | William Organ | 70 | 10.2 | ||
| Majority | 70 | 10.2 | |||
| Turnout | 684 | 37.1 | |||
| Party | Candidate | Votes | % | ± | |
|---|---|---|---|---|---|
| Conservative | Brian Dutton | 346 | 55.6 | ||
| Liberal Democrat | Phillip Humphries | 276 | 44.4 | ||
| Majority | 70 | 11.3 | |||
| Turnout | 622 | 36.9 | |||
| Party | Candidate | Votes | % | ± | |
|---|---|---|---|---|---|
| Conservative | Robert Ayer | 539 | 62.3 | ||
| Liberal Democrat | Karen Bradbury | 235 | 27.2 | ||
| Labour | Maureen Stephens | 91 | 10.5 | ||
| Majority | 304 | 35.1 | |||
| Turnout | 865 | 48.1 | |||
| Party | Candidate | Votes | % | ± | |
|---|---|---|---|---|---|
| Conservative | Andrew Pattie | 500 | 74.9 | ||
| Labour | Christine Straw | 168 | 25.1 | ||
| Majority | 332 | 49.7 | |||
| Turnout | 668 | 43.0 | |||
| Party | Candidate | Votes | % | ± | |
|---|---|---|---|---|---|
| Conservative | Hilary Ayer | 373 | 64.8 | ||
| Liberal Democrat | David Jamieson | 203 | 35.2 | ||
| Majority | 170 | 29.5 | |||
| Turnout | 576 | 32.2 | |||
| Party | Candidate | Votes | % | ± | |
|---|---|---|---|---|---|
| Liberal Democrat | David Clegg | 544 | 63.4 | ||
| Conservative | William Johnston | 314 | 36.6 | ||
| Majority | 230 | 26.8 | |||
| Turnout | 858 | 41.6 | |||
| Party | Candidate | Votes | % | ± | |
|---|---|---|---|---|---|
| Liberal Democrat | Christopher Graham | 506 | 51.4 | ||
| Conservative | Andrew Brown | 479 | 48.6 | ||
| Majority | 27 | 2.7 | |||
| Turnout | 985 | 58.6 | |||
| Party | Candidate | Votes | % | ± | |
|---|---|---|---|---|---|
| Conservative | Warwick Womack | 418 | 52.1 | ||
| Liberal Democrat | Pelham Ravenscroft | 385 | 47.9 | ||
| Majority | 33 | 4.1 | |||
| Turnout | 803 | 45.6 | |||
| Party | Candidate | Votes | % | ± | |
|---|---|---|---|---|---|
| Conservative | Judy Onslow | unopposed | |||
| Party | Candidate | Votes | % | ± | |
|---|---|---|---|---|---|
| Liberal Democrat | Zoya Faddy | 317 | 75.8 | ||
| Conservative | Joseph Davies | 101 | 24.2 | ||
| Majority | 216 | 51.7 | |||
| Turnout | 418 | 22.9 | |||
| Party | Candidate | Votes | % | ± | |
|---|---|---|---|---|---|
| Liberal Democrat | Helen Walters | 247 | 61.0 | ||
| Conservative | Michael Cartwright | 158 | 39.0 | ||
| Majority | 89 | 22.0 | |||
| Turnout | 405 | 20.4 | |||
| Party | Candidate | Votes | % | ± | |
|---|---|---|---|---|---|
| Liberal Democrat | William Watkinson | 349 | 72.9 | ||
| Conservative | Valerie Ferns | 130 | 27.1 | ||
| Majority | 219 | 45.7 | |||
| Turnout | 479 | 27.5 | |||
| Party | Candidate | Votes | % | ± | |
|---|---|---|---|---|---|
| Liberal Democrat | Donald Mayes | 153 | 59.8 | ||
| Conservative | Philip Cochrane | 103 | 40.2 | ||
| Majority | 50 | 19.5 | |||
| Turnout | 256 | 13.7 | |||
| Party | Candidate | Votes | % | ± | |
|---|---|---|---|---|---|
| Liberal Democrat | Adam Carew | 504 | 80.9 | ||
| Conservative | Barry Hope | 119 | 19.1 | ||
| Majority | 385 | 61.8 | |||
| Turnout | 623 | 36.0 | |||
References
- ↑ "Local elections". BBC News Online. Retrieved 29 August 2011.
- 1 2 "Local council election results". The Daily Telegraph. 3 May 2003. Retrieved 31 August 2011.
- 1 2 3 4 5 6 7 8 9 10 11 12 13 14 15 16 17 18 19 20 21 22 23 24 25 26 27 28 29 30 31 32 33 34 35 36 37 38 39 40 "Summary of District Election Results – 1 May 2003". East Hampshire District Council. Retrieved 29 August 2011.
| Metropolitan boroughs |
|
|---|---|
| Unitary authorities |
|
| District councils (England) |
|
| Scottish councils |
|
| National Assembly elections | |
This article is issued from Wikipedia - version of the 11/29/2015. The text is available under the Creative Commons Attribution/Share Alike but additional terms may apply for the media files.