Calder Valley (UK Parliament constituency)
Coordinates: 53°42′18″N 1°56′13″W / 53.705°N 1.937°W
| Calder Valley | |
|---|---|
|
County constituency for the House of Commons | |
|
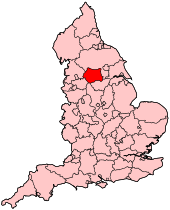
Boundary of Calder Valley in West Yorkshire. | |
|
Location of West Yorkshire within England. | |
| County | West Yorkshire |
| Population | 102,961 (2011 census)[1] |
| Electorate | 76,041 (December 2010)[2] |
| Major settlements | Hebden Bridge, Sowerby Bridge, Todmorden, Mytholmroyd, Brighouse, Rishworth, Rastrick, Elland |
| Current constituency | |
| Created | 1983 |
| Member of parliament | Craig Whittaker (Conservative) |
| Number of members | One |
| Created from |
Sowerby Brighouse and Spenborough Halifax[3] |
| Overlaps | |
| European Parliament constituency | Yorkshire and the Humber |

Calder Valley is a constituency represented in the House of Commons of the UK Parliament since 2010 by Craig Whittaker of the Conservative Party.[n 1]
Boundaries
Since the constituency's creation in 1983 it has comprised the Metropolitan Borough of Calderdale wards of Brighouse, Calder Valley, Elland, Greetland and Stainland, Hipperholme and Lightcliffe, Luddendenfoot, Rastrick, Ryburn, and Todmorden.
The constituency covers most of the upland metropolitan district of Calderdale in West Yorkshire including the town of Todmorden which was formerly split in half between Lancashire and Yorkshire.
History
The constituency was created in 1983, primarily from the former seat of Sowerby as well as parts of Brighouse and Spenborough. Historically a bellwether seat between Labour and the Conservatives, in the 2010 general election the seat became the closest three-way marginal in the north of England, with less than 1,000 votes between the Labour and Liberal Democrat Candidates in terms of 2nd and 3rd place, although with a significant Conservative majority for 1st place. In 2015 Labour regained significant vote share with the Liberal Democrats falling back, but the seat was retained by the Conservatives in line with national trends maintaining the bellwether status.
Members of Parliament
| Election | Member[4][5] | Party | |
|---|---|---|---|
| 1983 | Sir Donald Thompson | Conservative | |
| 1997 | Christine McCafferty | Labour | |
| 2010 | Craig Whittaker | Conservative | |
Elections
Elections in the 2010s
| Party | Candidate | Votes | % | ± | |
|---|---|---|---|---|---|
| Conservative | Craig Whittaker | 23,354 | 43.6 | +4.2 | |
| Labour | Josh Fenton-Glynn | 18,927 | 35.4 | +8.4 | |
| UKIP | Paul Rogan | 5,950 | 11.1 | +8.8 | |
| Liberal Democrat | Alisdair Calder McGregor | 2,666 | 5.0 | −20.2 | |
| Green | Jenny Shepherd | 2,090 | 3.9 | +2.2 | |
| Yorkshire First | Rod Sutcliffe | 389 | 0.7 | +0.7 | |
| World Peace Through Song | Joe Stead | 165 | 0.3 | +0.3 | |
| Majority | 4,427 | 8.3 | −4.1 | ||
| Turnout | 53,541 | 68.9 | +1.6 | ||
| Conservative hold | Swing | ||||
| Party | Candidate | Votes | % | ± | |
|---|---|---|---|---|---|
| Conservative | Craig Whittaker | 20,397 | 39.4 | +3.6 | |
| Labour | Steph Booth | 13,966 | 27.0 | −11.5 | |
| Liberal Democrat | Hilary Myers | 13,037 | 25.2 | +6.3 | |
| BNP | John Gregory | 1,823 | 3.5 | −0.4 | |
| UKIP | Greg Burrows | 1,173 | 2.3 | N/A | |
| Green | Kate Sweeny | 858 | 1.7 | −1.2 | |
| Independent | Tim Cole | 194 | 0.4 | N/A | |
| Independent | Barry Greenwood | 175 | 0.3 | N/A | |
| English Democrat | Paul Rogan | 157 | 0.3 | N/A | |
| Majority | 6,431 | 12.4 | |||
| Turnout | 51,780 | 67.3 | +1.3 | ||
| Conservative gain from Labour | Swing | 7.6 | |||
Elections in the 2000s
| Party | Candidate | Votes | % | ± | |
|---|---|---|---|---|---|
| Labour | Christine McCafferty | 18,426 | 38.6 | −4.1 | |
| Conservative | Liz Truss | 17,059 | 35.7 | −0.5 | |
| Liberal Democrat | Liz Ingleton | 9,027 | 18.9 | +2.9 | |
| BNP | John Gregory | 1,887 | 4.0 | N/A | |
| Green | Paul Palmer | 1,371 | 2.9 | +0.7 | |
| Majority | 1,367 | 2.9 | −3.6 | ||
| Turnout | 47,770 | 67.0 | +4.0 | ||
| Labour hold | Swing | −1.8 | |||
| Party | Candidate | Votes | % | ± | |
|---|---|---|---|---|---|
| Labour | Christine McCafferty | 20,244 | 42.7 | −3.4 | |
| Conservative | Susan Kay Robson-Catling | 17,150 | 36.2 | +1.1 | |
| Liberal Democrat | Michael Francis Taylor | 7,596 | 16.0 | +1.3 | |
| Green | Steven Robert Hutton | 1,034 | 2.2 | +1.3 | |
| UKIP | John David Nunn | 729 | 1.5 | N/A | |
| Legalise Cannabis | Philip David Lockwood | 672 | 1.4 | N/A | |
| Majority | 3,094 | 6.5 | |||
| Turnout | 47,425 | 63.0 | −12.4 | ||
| Labour hold | Swing | −2.3 | |||
Elections in the 1990s
| Party | Candidate | Votes | % | ± | |
|---|---|---|---|---|---|
| Labour | Christine McCafferty | 26,050 | 46.10 | +8.7 | |
| Conservative | Donald Thompson | 19,795 | 35.10 | −10.3 | |
| Liberal Democrat | Stephen John Pearson | 8,322 | 14.7 | −1.4 | |
| Referendum | Anthony Mellor | 1,380 | 2.4 | N/A | |
| Green | Ms. Vivienne Patricia Smith | 488 | 0.9 | −0.1 | |
| BNP | Christian Jackson | 431 | 0.80 | N/A | |
| Majority | 6,255 | 11.0 | |||
| Turnout | 56,466 | 75.4 | −6.7 | ||
| Labour gain from Conservative | Swing | + 9.5 | |||
| Party | Candidate | Votes | % | ± | |
|---|---|---|---|---|---|
| Conservative | Donald Thompson | 27,753 | 45.4 | +1.9 | |
| Labour | David Chaytor | 22,875 | 37.4 | +4.1 | |
| Liberal Democrat | Stephen John Pearson | 9,842 | 16.1 | −7.0 | |
| Green | Ms. Vivienne Patricia Smith | 622 | 1.0 | +1.0 | |
| Majority | 4,878 | 8.0 | −2.2 | ||
| Turnout | 61,092 | 82.1 | +1.0 | ||
| Conservative hold | Swing | −1.1 | |||
Elections in the 1980s
| Party | Candidate | Votes | % | ± | |
|---|---|---|---|---|---|
| Conservative | Donald Thompson | 25,892 | 43.5 | −0.2 | |
| Labour | David Chaytor | 19,847 | 33.4 | +6.4 | |
| Liberal | David Trevor Shutt | 13,761 | 23.1 | −6.3 | |
| Majority | 6,045 | 10.1 | |||
| Turnout | 59,500 | 81.1 | |||
| Conservative hold | Swing | −3.3 | |||
| Party | Candidate | Votes | % | ± | |
|---|---|---|---|---|---|
| Conservative | Donald Thompson | 24,439 | 43.7 | N/A | |
| Liberal | David Trevor Shutt | 16,440 | 29.4 | N/A | |
| Labour | Mrs. Patricia Ann Holmes | 15,108 | 27.0 | N/A | |
| Majority | 7,999 | 14.3 | N/A | ||
| Turnout | 55,987 | 78.5 | N/A | ||
| Conservative win (new seat) | |||||
See also
Notes
- ↑ As with all constituencies, the constituency elects one Member of Parliament (MP) by the first past the post system of election at least every five years.
References
- ↑ "Calder Valley: Usual Resident Population, 2011". Neighbourhood Statistics. Office for National Statistics. Retrieved 8 February 2015.
- ↑ "Electorate Figures - Boundary Commission for England". 2011 Electorate Figures. Boundary Commission for England. 4 March 2011. Archived from the original on 6 November 2010. Retrieved 13 March 2011.
- ↑ "'Calder Valley', June 1983 up to May 1997". ElectionWeb Project. Cognitive Computing Limited. Retrieved 10 March 2016.
- ↑ "Calder Valley 1983-". Hansard 1803-2005. UK Parliament. Retrieved 2 February 2015.
- ↑ Leigh Rayment's Historical List of MPs – Constituencies beginning with "C" (part 1)
- ↑ "Election Data 2015". Electoral Calculus. Archived from the original on 17 October 2015. Retrieved 17 October 2015.
- ↑ "Calder Valley". BBC News. Retrieved 13 May 2015.
- ↑ "Election Data 2010". Electoral Calculus. Archived from the original on 26 July 2013. Retrieved 17 October 2015.
- ↑ http://www.calderdale.gov.uk/council/democracy/election-information/caldervalley-constituency/calder-valley.html
- ↑ "UK > England > Yorkshire & the Humber > Calder Valley". Election 2010. BBC. 7 May 2010. Retrieved 12 May 2010.
- ↑ "Election Data 2005". Electoral Calculus. Archived from the original on 15 October 2011. Retrieved 18 October 2015.
- ↑ "Election Data 2001". Electoral Calculus. Archived from the original on 15 October 2011. Retrieved 18 October 2015.
- ↑ "Election Data 1997". Electoral Calculus. Archived from the original on 15 October 2011. Retrieved 18 October 2015.
- ↑ "Election Data 1992". Electoral Calculus. Archived from the original on 15 October 2011. Retrieved 18 October 2015.
- ↑ "Politics Resources". Election 1992. Politics Resources. 9 April 1992. Retrieved 6 December 2010.
- ↑ "Election Data 1987". Electoral Calculus. Archived from the original on 15 October 2011. Retrieved 18 October 2015.
- ↑ "Election Data 1983". Electoral Calculus. Archived from the original on 15 October 2011. Retrieved 18 October 2015.
- Sources
External links
- nomis Constituency Profile for Calder Valley — presenting data from the ONS annual population survey and other official statistics.