Doncaster North (UK Parliament constituency)
Coordinates: 53°34′37″N 1°03′18″W / 53.577°N 1.055°W
| Doncaster North | |
|---|---|
|
County constituency for the House of Commons | |
|
Boundary of Doncaster North in South Yorkshire. | |
|
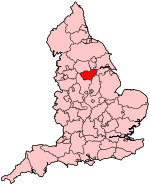
Location of South Yorkshire within England. | |
| County | South Yorkshire |
| Electorate | 72,855 (December 2010)[1] |
| Major settlements | Mexborough, Stainforth[2] |
| Current constituency | |
| Created | 1983 |
| Member of parliament | Ed Miliband (Labour) |
| Number of members | One |
| Created from | Don Valley and Goole[3] |
| Overlaps | |
| European Parliament constituency | Yorkshire and the Humber |
Doncaster North is a constituency[n 1] in South Yorkshire represented in the House of Commons of the UK Parliament since 2005 by Ed Miliband of the Labour Party.[n 2]
History
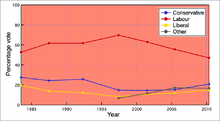
The constituency was created in 1983 from parts of the seats of Don Valley and Goole, and has always been a Labour stronghold. Its MP since 2005 has been Ed Miliband, who was Leader of the Labour Party and Leader of the Opposition from 2010 to 2015.
Boundaries
1983-1997: The Metropolitan Borough of Doncaster wards of Adwick, Askern, Bentley Central, Bentley North Road, Hatfield, Stainforth, and Thorne.
1997-2010: The Metropolitan Borough of Doncaster wards of Adwick, Askern, Bentley Central, Bentley North Road, Stainforth, and Thorne.
2010-present: The Metropolitan Borough of Doncaster wards of Adwick, Askern Spa, Bentley, Great North Road, Mexborough, Sprotbrough, and Stainforth and Moorends.
Constituency profile
The constituency covers largely rural areas north of Doncaster, stretching to partly suburban Mexborough in the west, Bentley that lies on the northern banks of the River Don and Adwick which is farther north. The seat is an area with moderate typical incomes which has yet to recover fully from the almost total end locally in the coal mining industry[n 3] but large numbers of constituents work in construction and manufacturing.[4][5][6][7]
Since Doncaster North constituency was formed in 1983, it has only elected Labour MPs.
Members of Parliament
| Election | Member[5] | Party | |
|---|---|---|---|
| 1983 | Michael Welsh | Labour | |
| 1992 | Kevin Hughes | Labour | |
| 2005 | Ed Miliband | Labour | |
Elections
Elections in the 2010s

| Party | Candidate | Votes | % | ± | |
|---|---|---|---|---|---|
| Labour | Ed Miliband | 20,708 | 52.4 | +5.1 | |
| UKIP | Kim Parkinson | 8,928 | 22.6 | +18.3 | |
| Conservative | Mark Fletcher | 7,235 | 18.3 | −2.7 | |
| Liberal Democrat | Penny Baker | 1,005 | 2.5 | −12.3 | |
| Green | Pete Kennedy | 757 | 1.9 | +1.9 | |
| English Democrat | David Allen | 448 | 1.1 | −4.0 | |
| TUSC | Mary Jackson | 258 | 0.7 | +0.2 | |
| Monster Raving Loony | Nick the Flying Brick | 162 | 0.4 | +0.4 | |
| Majority | 11,780 | 29.8 | +3.5 | ||
| Turnout | 39,501 | 55.7 | −1.6 | ||
| Labour hold | Swing | −6.1 | |||
| Party | Candidate | Votes | % | ± | |
|---|---|---|---|---|---|
| Labour | Ed Miliband | 19,637 | 47.3 | -8.8 | |
| Conservative | Sophie Brodie | 8,728 | 21.0 | +6.8 | |
| Liberal Democrat | Ed Sanderson | 6,174 | 14.9 | −0.8 | |
| BNP | Pamela Chambers | 2,818 | 6.8 | +2.8 | |
| English Democrat | Wayne Crawshaw | 2,148 | 5.2 | +3.7 | |
| UKIP | Liz Andrews | 1,797 | 4.3 | +2.1 | |
| TUSC | Bill Rawcliffe | 181 | 0.4 | N/A | |
| Majority | 10,909 | 26.3 | -12.7 | ||
| Turnout | 41,483 | 57.3 | +4.7 | ||
| Labour hold | Swing | −2.8 | |||
Elections in the 2000s
| Party | Candidate | Votes | % | ± | |
|---|---|---|---|---|---|
| Labour | Ed Miliband | 17,531 | 55.5 | -7.6 | |
| Conservative | Martin Drake | 4,875 | 15.4 | +0.7 | |
| Liberal Democrat | Doug Pickett | 3,800 | 12.0 | +1.4 | |
| Community Group | Martin Williams | 2,365 | 7.5 | N/A | |
| BNP | Lee Hagan | 1,506 | 4.8 | N/A | |
| UKIP | Robert Nixon | 940 | 3.0 | +0.7 | |
| English Democrat | Michael Cassidy | 561 | 1.8 | N/A | |
| Majority | 12,656 | 40.1 | -8.3 | ||
| Turnout | 31,578 | 51.1 | +0.6 | ||
| Labour hold | Swing | −4.2 | |||
| Party | Candidate | Votes | % | ± | |
|---|---|---|---|---|---|
| Labour | Kevin Michael Hughes | 19,788 | 63.1 | -6.7 | |
| Conservative | Anita Kapoor | 4,601 | 14.7 | -0.1 | |
| Liberal Democrat | Colin Ross | 3,323 | 10.6 | +2.1 | |
| Independent | Martin Williams | 2,926 | 9.3 | N/A | |
| UKIP | John Wallis | 725 | 2.3 | N/A | |
| Majority | 15,187 | 48.4 | -6.6 | ||
| Turnout | 31,363 | 50.5 | -12.8 | ||
| Labour hold | Swing | −3.3 | |||
Elections in the 1990s
| Party | Candidate | Votes | % | ± | |
|---|---|---|---|---|---|
| Labour | Kevin Michael Hughes | 27,843 | 69.8 | +8.0 | |
| Conservative | Peter Kennerley | 5,906 | 14.8 | -7.5 | |
| Liberal Democrat | Michael Cook | 3,369 | 8.4 | -4.5 | |
| Referendum | Ron Thornton | 1,589 | 4.0 | N/A | |
| Anti Sleaze Labour | Neil Swan | 1,181 | 3.0 | N/A | |
| Majority | 21,937 | 55.0 | +12.9 | ||
| Turnout | 39,888 | 63.3 | -10.6 | ||
| Labour hold | Swing | +6.6 | |||
| Party | Candidate | Votes | % | ± | |
|---|---|---|---|---|---|
| Labour | Kevin Michael Hughes | 34,135 | 61.8 | +0.0 | |
| Conservative | Robert C Light | 14,322 | 25.9 | +1.5 | |
| Liberal Democrat | Steve Whiting | 6,787 | 12.3 | N/A | |
| Majority | 19,813 | 35.9 | -1.5 | ||
| Turnout | 55,244 | 73.9 | +0.8 | ||
| Labour hold | Swing | -0.7 | |||
Elections in the 1980s
| Party | Candidate | Votes | % | ± | |
|---|---|---|---|---|---|
| Labour | Michael Collins Welsh | 32,950 | 61.8 | +9.0 | |
| Conservative | Richard James Shepherd | 13,015 | 24.4 | -3.2 | |
| Social Democratic | Peter Richard Norwood | 7,394 | 13.9 | -5.8 | |
| Majority | 19,935 | 37.4 | +12.2 | ||
| Turnout | 53,359 | 73.1 | +3.4 | ||
| Labour hold | Swing | +6.1 | |||
| Party | Candidate | Votes | % | ± | |
|---|---|---|---|---|---|
| Labour | Michael Collins Welsh | 26,626 | 52.8 | N/A | |
| Conservative | Michael Stephen | 13,915 | 27.6 | N/A | |
| Social Democratic | D Orford | 9,916 | 19.7 | N/A | |
| Majority | 12,711 | 25.2 | N/A | ||
| Turnout | 50,457 | 69.9 | N/A | ||
| Labour win (new seat) | |||||
See also
Notes and references
- Notes
- ↑ A county constituency (for the purposes of election expenses and type of returning officer)
- ↑ As with all constituencies, the constituency elects one Member of Parliament (MP) by the first past the post system of election at least every five years.
- ↑ See British Coal
- References
- ↑ "Electorate Figures – Boundary Commission for England". 2011 Electorate Figures. Boundary Commission for England. 4 March 2011. Retrieved 13 March 2011.
- ↑ "The Parliamentary Constituencies (England) Order 2007". The Parliamentary Constituencies (England) Order 2007. The National Archives. 13 June 2007. Retrieved 15 January 2011.
- ↑ "'Doncaster North', June 1983 up to May 1997". ElectionWeb Project. Cognitive Computing Limited. Retrieved 10 March 2016.
- ↑ "Check Browser Settings". statistics.gov.uk.
- 1 2 Leigh Rayment's Historical List of MPs – Constituencies beginning with "D" (part 2)
- ↑ Guardian Unlimited Politics Election results from 1992 to the present
- ↑ Politics Resources Election results from 1945 to present
- ↑ "Election Data 2015". Electoral Calculus. Archived from the original on 17 October 2015. Retrieved 17 October 2015.
- ↑ "Doncaster North". BBC News. Retrieved 14 May 2015.
- ↑ "Election Data 2010". Electoral Calculus. Archived from the original on 26 July 2013. Retrieved 17 October 2015.
- ↑ "UK > England > Yorkshire & the Humber > Doncaster North". Election 2010. BBC. 7 May 2010. Retrieved 12 May 2010.
- ↑ "Election Data 2005". Electoral Calculus. Archived from the original on 15 October 2011. Retrieved 18 October 2015.
- ↑ "Doncaster North: Constituency > Politics > guardian.co.uk". Election 2010. The Guardian. 5 May 2005. Retrieved 22 January 2011.
- ↑ "Election Data 2001". Electoral Calculus. Archived from the original on 15 October 2011. Retrieved 18 October 2015.
- ↑ "BBC NEWS > VOTE 2001 > RESULTS & CONSTITUENCIES > Doncaster North". Vote 2001. BBC News. 7 June 2001. Retrieved 22 January 2011.
- ↑ "Election Data 1997". Electoral Calculus. Archived from the original on 15 October 2011. Retrieved 18 October 2015.
- ↑ "Politics Resources". Election 1997. Politics Resources. 1 May 1997. Retrieved 7 January 2011.
- ↑ C. Rallings & M. Thrasher, The Media Guide to the New Parliamentary Constituencies, p.67 (Plymouth: LGC Elections Centre, 1995)
- ↑ The 1997 election result is calculated relative to the notional, not the actual, 1992 result.
- ↑ "BBC NEWS>VOTE 2001>Results and Constituencies>Doncaster North". Vote 2001. BBC News. 1 May 1997. Retrieved 12 January 2011.
- ↑ "Election Data 1992". Electoral Calculus. Archived from the original on 15 October 2011. Retrieved 18 October 2015.
- ↑ "Politics Resources". Election 1992. Politics Resources. 9 April 1992. Retrieved 6 December 2010.
- ↑ "Election Data 1987". Electoral Calculus. Archived from the original on 15 October 2011. Retrieved 18 October 2015.
- ↑ "Election Data 1983". Electoral Calculus. Archived from the original on 15 October 2011. Retrieved 18 October 2015.
Sources
- Ed Miliband, MP for Doncaster North The website of Ed Miliband
| Parliament of the United Kingdom | ||
|---|---|---|
| Preceded by Camberwell and Peckham |
Constituency represented by the Leader of the Opposition 2010–2015 |
Succeeded by Camberwell and Peckham |

