Hemsworth (UK Parliament constituency)
Coordinates: 53°36′50″N 1°21′14″W / 53.614°N 1.354°W
| Hemsworth | |
|---|---|
|
County constituency for the House of Commons | |
|
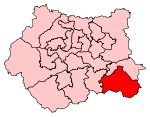
Boundary of Hemsworth in West Yorkshire for the 2010 general election. | |
|
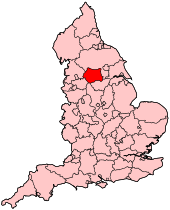
Location of West Yorkshire within England. | |
| County | West Yorkshire |
| Electorate | 73,487 (December 2010)[1] |
| Major settlements | South Wakefield, Hemsworth and Featherstone |
| Current constituency | |
| Created | 1918 |
| Member of parliament | Jon Trickett (Labour) |
| Number of members | One |
| Created from | Barnsley and Osgoldcross |
| Overlaps | |
| European Parliament constituency | Yorkshire and the Humber |
Hemsworth is a constituency[n 1] in West Yorkshire represented in the House of Commons since 1996 by Jon Trickett of the Labour Party.[n 2]
Constituency profile
The constituency comprises former coal mining towns and villages that also provided some of the workforce for the manufacturing bases of the town of Barnsley to the south and cities of Wakefield and Leeds to the northwest. Many constituents still commute to these today. Nearby to the east over the border in North Yorkshire is Kellingley Colliery, one of six functional coal mines and only three deep mines still in major production. It is the Labour Party's longest held seat, having elected its first Labour MP in 1918, and been in continuous existence since that date.
History
From the 1966 to February 1974 general elections (inclusive), Hemsworth was the safest seat for any party in the UK: the Labour vote had peaked in 1966 at 85.39%[2] and consistently exceeded 80% from 1935 until October 1974 when the Liberal Party contested the seat for the first time since 1923. Successive boundary changes removed certain ex-mining communities to the new Barnsley East constituency in 1983: this and the addition of the highest income part of Wakefield[n 3] in 1997 slightly reduced Labour's dominance, but Hemsworth remains a safe seat.
- Present member
The incumbent member at Westminster is Jon Trickett, former Leader of City of Leeds Council.
Boundaries
1918-1950: The Urban Districts of Cudworth and Royston, the Rural District of Hemsworth, and part of the Rural District of Barnsley.
1950-1983: The Urban Districts of Cudworth, Dearne, Hemsworth, and Royston, and the Rural District of Hemsworth.
1983-1997: The City of Wakefield wards of Crofton and Ackworth; Featherstone; Hemsworth; South Elmsall; and South Kirkby.
1997-2010: The City of Wakefield wards of Crofton and Ackworth; Featherstone; Hemsworth; South Elmsall; South Kirkby; and Wakefield South.
2010-present: The City of Wakefield wards of Ackworth, North Elmsall and Upton; Crofton, Ryhill and Walton; Featherstone; Hemsworth; South Elmsall and South Kirkby; and Wakefield South.
This constituency covers the towns of Hemsworth, Featherstone, South Kirkby & Moorthorpe and South Elmsall plus the southern part of Wakefield (Sandal, Agbrigg, Belle Vue) and the villages of Ackworth, Crofton, Fitzwilliam, Upton, Sharlston, Streethouse, Walton and Notton in the City of Wakefield district.
Members of Parliament
Elections
| 1910s | 1920s | 1930s | 1940s | 1950s | 1960s | 1970s | 1980s | 1990s | 2000s |
Elections in the 2010s
| Party | Candidate | Votes | % | ± | |
|---|---|---|---|---|---|
| Labour | Jon Trickett | 21,772 | 51.3 | +4.6 | |
| Conservative | Christopher Pearson | 9,694 | 22.9 | -1.5 | |
| UKIP | Steve Ashton | 8,565 | 20.2 | +20.2 | |
| Liberal Democrat | Mary MacQueen | 1,357 | 3.2 | -9.7 | |
| Yorkshire First | Martin Roberts | 1,018 | 2.4 | +2.4 | |
| Majority | 12,078 | 28.5 | |||
| Turnout | 42,406 | 58.3 | |||
| Labour hold | Swing | ||||
| Party | Candidate | Votes | % | ± | |
|---|---|---|---|---|---|
| Labour | Jon Trickett | 20,506 | 46.8 | -11.9 | |
| Conservative | Ann Elizabeth Myatt | 10,662 | 24.3 | +2.2 | |
| Liberal Democrat | Alan Belmore | 5,667 | 12.9 | -2.8 | |
| Independent | Ian Womersley | 3,946 | 9.0 | N/A | |
| BNP | Ian Ashley Kitchen | 3,059 | 7.0 | N/A | |
| Majority | 9,844 | 22.5 | |||
| Turnout | 43,840 | 60.4 | +6.1 | ||
| Labour hold | Swing | -7.0 | |||
Elections in the 2000s
| Party | Candidate | Votes | % | ± | |
|---|---|---|---|---|---|
| Labour | Jon Trickett | 21,630 | 58.8 | −6.6 | |
| Conservative | Jonathan Mortimer | 8,149 | 22.1 | +1.1 | |
| Liberal Democrat | David Hall-Matthews | 5,766 | 15.7 | +4.4 | |
| Veritas | John Burdon | 1,247 | 3.4 | N/A | |
| Majority | 13,481 | 36.6 | |||
| Turnout | 36,792 | 54.6 | +2.8 | ||
| Labour hold | Swing | -3.85 | |||
| Party | Candidate | Votes | % | ± | |
|---|---|---|---|---|---|
| Labour | Jon Trickett | 23,036 | 65.4 | −5.2 | |
| Conservative | Elizabeth Truss | 7,400 | 21.0 | +3.2 | |
| Liberal Democrat | Ed Waller | 3,990 | 11.3 | +2.5 | |
| Socialist Labour | Paul Turek | 801 | 2.3 | N/A | |
| Majority | 15,636 | 44.4 | |||
| Turnout | 35,227 | 51.8 | −16.1 | ||
| Labour hold | Swing | ||||
Elections in the 1990s
| Party | Candidate | Votes | % | ± | |
|---|---|---|---|---|---|
| Labour | Jon Trickett | 32,088 | 70.6 | +6.8 [12] | |
| Conservative | Norman Hazel | 8,096 | 17.8 | -8.0 [13] | |
| Liberal Democrat | Jacqueline Kirby | 4,033 | 8.9 | -1.5 [14] | |
| Referendum | Derek Irvine | 1,260 | 2.8 | N/A | |
| Majority | 23,992 | 52.8 | +14.8 [15] | ||
| Turnout | 45,477 | 67.9 | -8.0 | ||
| Labour hold | Swing | +7.4 [16] | |||
| Party | Candidate | Votes | % | ± | |
|---|---|---|---|---|---|
| Labour | Jon Trickett | 15,817 | 71.9 | +1.1 | |
| Conservative | Norman Hazell | 1,942 | 8.8 | -9.8 | |
| Liberal Democrat | David Ridgeway | 1,516 | 6.9 | -3.7 | |
| Socialist Labour | Brenda Nixon | 1,193 | 5.4 | ||
| Monster Raving Loony | Screaming Lord Sutch | 652 | 3.0 | ||
| UKIP | Peter Davies | 455 | 2.1 | ||
| Green | Peg Alexander | 157 | 0.7 | ||
| Independent | Mark Thomas | 122 | 0.6 | ||
| National Democrats | Michael Cooper | 111 | 0.5 | ||
| Natural Law | Dianne Leighton | 28 | 0.1 | ||
| Majority | 13,875 | 63.1 | +10.9 | ||
| Turnout | 21,993 | 39.5 | -36.4 | ||
| Labour hold | Swing | +5.45 | |||
| Party | Candidate | Votes | % | ± | |
|---|---|---|---|---|---|
| Labour | Derek Enright | 29,942 | 70.8 | +3.8 | |
| Conservative | Garnet Harrison | 7,867 | 18.6 | +1.4 | |
| Liberal Democrat | Valerie Megson | 4,459 | 10.5 | -5.3 | |
| Majority | 22,075 | 52.2 | +2.4 | ||
| Turnout | 42,268 | 75.9 | +0.2 | ||
| Labour hold | Swing | +1.2 | |||
| Party | Candidate | Votes | % | ± | |
|---|---|---|---|---|---|
| Labour | Derek Enright | 15,895 | 66.3 | -0.7 | |
| Liberal Democrat | Valerie Megson | 4,808 | 20.1 | +4.3 | |
| Conservative | Garnet Harrison | 2,512 | 10.5 | -6.7 | |
| Independent Labour | Paul Ablett | 648 | 2.7 | ||
| Corrective Party | Timothy Smith | 108 | 0.5 | ||
| Majority | 11,097 | 46.3 | -3.5 | ||
| Turnout | 23,971 | ||||
| Labour hold | Swing | +3.0 | |||
Elections in the 1980s
| Party | Candidate | Votes | % | ± | |
|---|---|---|---|---|---|
| Labour | George Buckley | 27,859 | 67.0 | +7.7 | |
| Conservative | Edward Garnier | 7,159 | 17.2 | -2.4 | |
| Liberal | JD Wooffindin | 6,568 | 15.8 | -5.4 | |
| Majority | 20,700 | 49.8 | +11.7 | ||
| Turnout | 41,586 | 75.7 | +7.1 | ||
| Labour hold | Swing | ||||
| Party | Candidate | Votes | % | ± | |
|---|---|---|---|---|---|
| Labour | Alec Woodall | 22,081 | 59.3 | ||
| Liberal | JD Wooffindin | 7,891 | 21.2 | ||
| Conservative | D Williamson | 7,291 | 19.6 | ||
| Majority | 14,190 | 38.1 | |||
| Turnout | 37,263 | 68.6 | |||
| Labour hold | Swing | ||||
Elections in the 1970s
| Party | Candidate | Votes | % | ± | |
|---|---|---|---|---|---|
| Labour | Alec Woodall | 36,509 | 69.61 | ||
| Conservative | John Whitfield | 10,466 | 19.95 | ||
| Liberal | T Fussey | 5,474 | 10.44 | ||
| Majority | 26,043 | 49.65 | |||
| Turnout | 73.27 | ||||
| Labour hold | Swing | ||||
| Party | Candidate | Votes | % | ± | |
|---|---|---|---|---|---|
| Labour | Alec Woodall | 37,467 | 76.51 | ||
| Conservative | P Carvis | 5,895 | 12.04 | ||
| Liberal | R Taylor | 5,607 | 11.45 | ||
| Majority | 31,572 | 64.47 | |||
| Turnout | 70.15 | ||||
| Labour hold | Swing | ||||
| Party | Candidate | Votes | % | ± | |
|---|---|---|---|---|---|
| Labour | Alec Woodall | 44,093 | 82.81 | ||
| Conservative | RF Kerr | 9,152 | 17.19 | ||
| Majority | 34,941 | 65.62 | |||
| Turnout | 77.13 | ||||
| Labour hold | Swing | ||||
| Party | Candidate | Votes | % | ± | |
|---|---|---|---|---|---|
| Labour | Alan Beaney | 40,013 | 80.76 | ||
| Conservative | Michael C Tucker | 9,534 | 19.24 | ||
| Majority | 30,479 | 61.52 | |||
| Turnout | 71.89 | ||||
| Labour hold | Swing | ||||
Elections in the 1960s
| Party | Candidate | Votes | % | ± | |
|---|---|---|---|---|---|
| Labour | Alan Beaney | 41,887 | 85.39 | ||
| Conservative | Charles William Richards Pickthorn | 7,165 | 14.61 | ||
| Majority | 34,722 | 70.79 | |||
| Turnout | 76.02 | ||||
| Labour hold | Swing | ||||
| Party | Candidate | Votes | % | ± | |
|---|---|---|---|---|---|
| Labour | Alan Beaney | 42,528 | 83.07 | ||
| Conservative | John RM Keatley | 8,667 | 16.93 | ||
| Majority | 33,861 | 66.14 | |||
| Turnout | 78.81 | ||||
| Labour hold | Swing | ||||
Elections in the 1950s
| Party | Candidate | Votes | % | ± | |
|---|---|---|---|---|---|
| Labour | Alan Beaney | 45,153 | 82.18 | ||
| Conservative | William Henry Leay | 9,788 | 17.82 | ||
| Majority | 35,365 | 64.37 | |||
| Turnout | 83.62 | ||||
| Labour hold | Swing | ||||
| Party | Candidate | Votes | % | ± | |
|---|---|---|---|---|---|
| Labour | Horace Edwin Holmes | 42,603 | 83.27 | ||
| Conservative | William Henry Leay | 8,561 | 16.73 | ||
| Majority | 34,042 | 66.54 | |||
| Turnout | 79.87 | ||||
| Labour hold | Swing | ||||
| Party | Candidate | Votes | % | ± | |
|---|---|---|---|---|---|
| Labour | Horace Edwin Holmes | 47,402 | 82.71 | ||
| Conservative | George Wilfred Proudfoot | 9,911 | 17.29 | ||
| Majority | 37,491 | 65.41 | |||
| Turnout | 85.07 | ||||
| Labour hold | Swing | ||||
| Party | Candidate | Votes | % | ± | |
|---|---|---|---|---|---|
| Labour | Horace Edwin Holmes | 47,934 | 82.38 | ||
| Conservative | Miss Jean Patricia Asquith | 10,254 | 17.62 | ||
| Majority | 37,680 | 64.76 | |||
| Turnout | 88.21 | ||||
| Labour hold | Swing | ||||
Elections in the 1940s
| Party | Candidate | Votes | % | ± | |
|---|---|---|---|---|---|
| Labour | Horace Edwin Holmes | unopposed | n/a | n/a | |
| Labour hold | Swing | n/a | |||
| Party | Candidate | Votes | % | ± | |
|---|---|---|---|---|---|
| Labour | George Arthur Griffiths | 33,984 | 81.4 | +1.3 | |
| Conservative | Robert William Palliser Dawson | 7,778 | 18.6 | −1.3 | |
| Majority | 26,206 | 62.8 | +2.6 | ||
| Turnout | 41,762 | 80.8 | +8.5 | ||
| Labour hold | Swing | +1.3 | |||
General Election 1939/40:
Another general election was required to take place before the end of 1940. The political parties had been making preparations for an election to take place from 1939 and by the end of this year, the following candidates had been selected;
- Labour: George Griffiths
- Conservative:
Elections in the 1930s
| Party | Candidate | Votes | % | ± | |
|---|---|---|---|---|---|
| Labour | George Arthur Griffiths | 28,298 | 80.1 | +9.6 | |
| Conservative | Francis Howard Collier | 7,032 | 19.9 | −9.6 | |
| Majority | 21,266 | 60.2 | +19.2 | ||
| Turnout | 35,330 | 72.3 | −0.6 | ||
| Labour hold | Swing | +9.6 | |||
| Party | Candidate | Votes | % | ± | |
|---|---|---|---|---|---|
| Labour | George Arthur Griffiths | unopposed | n/a | n/a | |
| Labour hold | Swing | n/a | |||
| Party | Candidate | Votes | % | ± | |
|---|---|---|---|---|---|
| Labour | Gabriel Price | 23,609 | 70.5 | −8.4 | |
| Unionist | William Francis Cuthbert Garthwaite | 9,867 | 29.5 | +8.4 | |
| Majority | 13,742 | 41.0 | −18.8 | ||
| Turnout | 33,476 | 72.9 | −2.9 | ||
| Labour hold | Swing | −8.4 | |||
Elections in the 1920s
| Party | Candidate | Votes | % | ± | |
|---|---|---|---|---|---|
| Labour | John Guest | 26,075 | 79.9 | +10.6 | |
| Unionist | R. A. Broughton | 6,578 | 20.1 | −10.6 | |
| Majority | 19,497 | 59.8 | +21.3 | ||
| Turnout | 32,653 | 75.8 | +6.1 | ||
| Labour hold | Swing | +10.6 | |||
| Party | Candidate | Votes | % | ± | |
|---|---|---|---|---|---|
| Labour | John Guest | 15,593 | 69.3 | −0.8 | |
| Unionist | H. R. Brown | 6,902 | 30.7 | +0.8 | |
| Majority | 8,691 | 38.6 | −1.6 | ||
| Turnout | 22,495 | 69.7 | +6.4 | ||
| Labour hold | Swing | −0.8 | |||
| Party | Candidate | Votes | % | ± | |
|---|---|---|---|---|---|
| Labour | John Guest | 13,159 | 70.1 | +6.9 | |
| Liberal | Huw Conway-Jones | 5,624 | 29.9 | n/a | |
| Majority | 7,535 | 40.2 | +13.8 | ||
| Turnout | 18,683 | 61.3 | −15.0 | ||
| Labour hold | Swing | ||||
| Party | Candidate | Votes | % | ± | |
|---|---|---|---|---|---|
| Labour | John Guest | 14,295 | 63.2 | +7.7 | |
| National Liberal | Frank William Crossley-Holland | 8,317 | 36.8 | n/a | |
| Majority | 5,978 | 26.4 | +15.4 | ||
| Turnout | 22.612 | 76.3 | +18.3 | ||
| Labour hold | Swing | ||||
Elections in the 1910s
| Party | Candidate | Votes | % | ± | |
|---|---|---|---|---|---|
| Labour | John Guest | 8,102 | 55.5 | ||
| Unionist |
|
6,490 | 44.5 | ||
| Majority | 1,612 | 11.0 | |||
| Turnout | 14,592 | 58.0 | |||
| Labour hold | Swing | ||||
- endorsed by Coalition Government
See also
- Hemsworth by-election, 1934
- Hemsworth by-election, 1946
- Hemsworth by-election, 1991
- Hemsworth by-election, 1996
- List of Parliamentary constituencies in West Yorkshire
Notes and references
- Notes
- ↑ A county constituency (for the purposes of election expenses and type of returning officer)
- ↑ As with all constituencies, the constituency elects one Member of Parliament (MP) by the first past the post system of election at least every five years.
- ↑ Excluding sub-districts of the city centre
- References
- ↑ "Electorate Figures - Boundary Commission for England". 2011 Electorate Figures. Boundary Commission for England. 4 March 2011. Retrieved 13 March 2011.
- ↑ Richard Kimber's Political Science Resources: UK General Election results March 1966
- ↑ Leigh Rayment's Historical List of MPs – Constituencies beginning with "H" (part 2)
- ↑ "Election Data 2015". Electoral Calculus. Archived from the original on 17 October 2015. Retrieved 17 October 2015.
- ↑ "Hemsworth". BBC News. Retrieved 13 May 2015.
- ↑ "Election Data 2010". Electoral Calculus. Archived from the original on 17 October 2015. Retrieved 17 October 2015.
- ↑ http://www.wakefield.gov.uk/CouncilAndDemocracy/ElectoralServices/Elections/generalcandidates.htm
- ↑ "UK > England > Yorkshire & the Humber > Hemsworth". Election 2010. BBC. 7 May 2010. Retrieved 12 May 2010.
- ↑ "Election Data 2005". Electoral Calculus. Archived from the original on 15 October 2011. Retrieved 18 October 2015.
- ↑ "Election Data 2001". Electoral Calculus. Archived from the original on 15 October 2011. Retrieved 18 October 2015.
- ↑ "Election Data 1997". Electoral Calculus. Archived from the original on 15 October 2011. Retrieved 18 October 2015.
- ↑ from 1992 notional result
- ↑ from 1992 notional result
- ↑ from 1992 notional result
- ↑ from 1992 notional result
- ↑ from 1992 notional result
- ↑ "Election Data 1992". Electoral Calculus. Archived from the original on 15 October 2011. Retrieved 18 October 2015.
- ↑ "Election Data 1987". Electoral Calculus. Archived from the original on 15 October 2011. Retrieved 18 October 2015.
- ↑ "Election Data 1983". Electoral Calculus. Archived from the original on 15 October 2011. Retrieved 18 October 2015.
- 1 2 3 4 5 6 7 8 9 10 British parliamentary election results 1918-1949, FWS Craig
Sources
- Craig, F. W. S. (1983) [1969]. British parliamentary election results 1918-1949 (3rd ed.). Chichester: Parliamentary Research Services. ISBN 0-900178-06-X.