California's 8th congressional district
| California's 8th congressional district | ||
|---|---|---|
.tif.png) | ||
| Current Representative | Paul Cook (R–Yucca Valley) | |
| Ethnicity | 50.2% White, 8.1% Black, 3.9% Asian, 35.3% Hispanic, 2.5[1]% other | |
| Cook PVI | R+10 | |
California's 8th congressional district is a congressional district in the U.S. state of California.
Paul Cook, a Republican from Yucca Valley, has represented the district since January 2013.
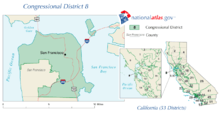
Currently, the 8th district encompasses most of the eastern desert regions of the state. It stretches from Mono Lake to Twentynine Palms. It consists of Inyo and Mono counties plus most of San Bernardino County.[2] It is one of the largest and most sparsely populated congressional districts in California. The largest city in the district is Victorville.
Prior to redistricting by the California Citizens Redistricting Commission of 2011, the 8th district was in San Francisco. The new district lines went into effect for the June 2012 elections.[3]
Demographics
The district is 50.2% white, 8.1% black, 3.9% Asian, 35.3% Hispanic, and 2.5% other. Among registered voters, 41.9% are registered with the Republican Party and 32.6% are registered with the Democratic Party. Voters affiliated with other or no parties make up 25.6% of the electorate.[1]
Competitiveness
Before the 2011 redistricting, the 8th district was a Democratic stronghold. It gave John Kerry his best performance in California in 2004, backing the Democrat with 84.2% of the vote. Barack Obama continued on this trend in 2008 when he received 85.22% of the vote in the district while John McCain received 12.38%.
The new 8th district lies in a politically conservative region of the state with a "Strongly Republican" Cook Partisan Voting Index of R+10. The Cook Political Report ranks it the 87th most Republican-leaning congressional district in the United States.[4]
In the 2012 election, the 8th district was one of only two in California where two Republicans faced each other in a runoff election.[5]
Election results from statewide races
| Year | Office | Winner | Tally |
|---|---|---|---|
| 1992 | President | Clinton | 75.6 - 15.9% |
| Senator | Boxer | 79.1 - 16.3% | |
| Senator | Feinstein | 82.4 - 14.0% | |
| 1994 | Governor | [Data unknown/missing. You can help!] | |
| Senator | [Data unknown/missing. You can help!] | ||
| 1996 | President | [Data unknown/missing. You can help!] | |
| 1998 | Governor | [Data unknown/missing. You can help!] | |
| Senator | [Data unknown/missing. You can help!] | ||
| 2000 | President[6] | Gore | 76.7 - 14.6% |
| Senator[7] | Feinstein | 72.6 - 14.1% | |
| 2002 | Governor[8] | Davis | 66.7 - 13.9% |
| 2003 | Recall[9][10] | No | 81.4 - 18.6% |
| Bustamante | 64.7 - 17.8% | ||
| 2004 | President[11] | Kerry | 84.2 - 14.0% |
| Senator[12] | Boxer | 83.7 - 11.7% | |
| 2006 | Governor[13] | Angelides | 64.3 - 27.9% |
| Senator[14] | Feinstein | 80.4 - 7.7% | |
| 2008 | President[15] | Obama | 85.2 - 12.4% |
| 2010 | Governor | Brown | 80.0 - 16.4% |
| Senator | Boxer | 81.3 - 14.7% | |
List of representatives
| Representative | Party | Dates | Notes | Counties |
|---|---|---|---|---|
| District created | March 4, 1903 | |||
.jpg) Milton J. Daniels Milton J. Daniels |
Republican | March 4, 1903 – March 3, 1905 |
Retired | Imperial, Inyo, Kern, Orange, Riverside, San Bernardino, San Diego, San Luis Obispo, Santa Barbara, Tulare, Ventura |
 Sylvester C. Smith Sylvester C. Smith |
Republican | March 4, 1905 – January 26, 1913 |
Died | |
| Vacant | January 27, 1913 – March 3, 1913 |
|||
 Everis A. Hayes Everis A. Hayes |
Republican | March 4, 1913 – March 3, 1919 |
Redistricted from the 5th district Lost re-election |
Monterey, San Benito, San Luis Obispo, San Mateo, Santa Barbara, Santa Clara, Santa Cruz, Ventura |
 Hugh S. Hersman Hugh S. Hersman |
Democratic | March 4, 1919 – March 3, 1921 |
Lost re-election | |
 Arthur M. Free Arthur M. Free |
Republican | March 4, 1921 – March 3, 1933 |
Lost re-election | |
.jpg) John J. McGrath John J. McGrath |
Democratic | March 4, 1933 – January 3, 1939 |
Lost re-election | Monterey, San Benito, San Mateo, Santa Clara, Santa Cruz |
 Jack Z. Anderson Jack Z. Anderson |
Republican | January 3, 1939 – January 3, 1943 |
||
| January 3, 1943 – January 3, 1953 |
Retired | San Benito, San Mateo, Santa Clara, Santa Cruz | ||
 George Paul Miller George Paul Miller |
Democratic | January 3, 1953 – January 3, 1973 |
Redistricted from the 6th district Lost renomination |
Alameda outside Oakland |
 Pete Stark Pete Stark |
Democratic | January 3, 1973 – January 3, 1975 |
Redistricted to the 9th district | |
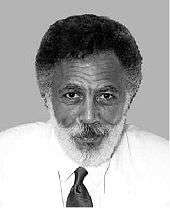 Ron Dellums Ron Dellums |
Democratic | January 3, 1975 – January 3, 1983 |
Redistricted from the 7th district Redistricted to the 9th district |
Alameda (Oakland) |
| January 3, 1983 – January 3, 1993 |
Alameda (Oakland), southwestern Contra Costa | |||
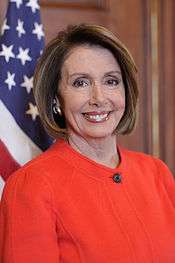 Nancy Pelosi Nancy Pelosi |
Democratic | January 3, 1993 – January 3, 2013 |
Redistricted from the 5th district Redistricted to the 12th district |
Most of San Francisco |
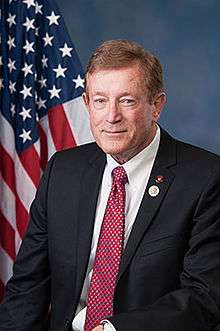 Paul Cook Paul Cook |
Republican | January 3, 2013 – present | Inyo, Mono, most of San Bernardino | |
Election results
|
1902 • 1904 • 1906 • 1908 • 1910 • 1912 • 1914 • 1916 • 1918 • 1920 • 1922 • 1924 • 1926 • 1928 • 1930 • 1932 • 1934 • 1936 • 1938 • 1940 • 1942 • 1944 • 1946 • 1948 • 1950 • 1952 • 1954 • 1956 • 1958 • 1960 • 1962 • 1964 • 1966 • 1968 • 1970 • 1972 • 1974 • 1976 • 1978 • 1980 • 1982 • 1984 • 1986 • 1988 • 1990 • 1992 • 1994 • 1996 • 1998 • 2000 • 2002 • 2004 • 2006 • 2008 • 2010 • 2012 • 2014 |
1902
| Party | Candidate | Votes | % | ||
|---|---|---|---|---|---|
| Republican | Milton J. Daniels | 20,135 | 55.6 | ||
| Democratic | William E. Smythe | 15,819 | 40.8 | ||
| Socialist | Noble A. Richardson | 2,091 | 5.4 | ||
| Prohibition | Ellsworth Leonardson | 762 | 2.0 | ||
| Total votes | 38,807 | 100.0 | |||
| Voter turnout | % | ||||
| Republican win (new seat) | |||||
1904
| Party | Candidate | Votes | % | |
|---|---|---|---|---|
| Republican | Sylvester C. Smith | 23,683 | 55.6 | |
| Democratic | William T. Lucas | 12,861 | 34.5 | |
| Socialist | Noble A. Richardson | 4,636 | 9.9 | |
| Prohibition | Benjamin J. Cloes | 1,430 | 3.4 | |
| Total votes | 42,610 | 100.0 | ||
| Voter turnout | % | |||
| Republican hold | ||||
1906
| Party | Candidate | Votes | % | |
|---|---|---|---|---|
| Republican | Sylvester C. Smith (inc.) | 22,548 | 55.6 | |
| Democratic | Charles A. Barlow | 13,992 | 34.5 | |
| Socialist | Noble A. Richardson | 4,003 | 9.9 | |
| Total votes | 40,543 | 100.0 | ||
| Voter turnout | % | |||
| Republican hold | ||||
1908
| Party | Candidate | Votes | % | |
|---|---|---|---|---|
| Republican | Sylvester C. Smith (inc.) | 28,202 | 50.5 | |
| Democratic | William G. Irving | 18,958 | 33.9 | |
| Socialist | George A. Garrett | 7,302 | 13.1 | |
| Prohibition | James S. Edwards | 1,379 | 2.5 | |
| Total votes | 45,831 | 100.0 | ||
| Voter turnout | % | |||
| Republican hold | ||||
1910
| Party | Candidate | Votes | % | |
|---|---|---|---|---|
| Republican | Sylvester C. Smith (inc.) | 28,202 | 50.5 | |
| Democratic | William G. Irving | 18,958 | 33.9 | |
| Socialist | George A. Garrett | 7,302 | 13.1 | |
| Prohibition | James S. Edwards | 1,379 | 2.5 | |
| Total votes | 45,831 | 100.0 | ||
| Voter turnout | % | |||
| Republican hold | ||||
1912
| Party | Candidate | Votes | % | |
|---|---|---|---|---|
| Republican | Everis A. Hayes (incumbent) | 29,861 | 50.9 | |
| Democratic | James B. Holohan | 20,620 | 35.2 | |
| Progressive | Robert Whitaker | 8,125 | 13.9 | |
| Total votes | 58,606 | 100.0 | ||
| Voter turnout | % | |||
| Republican hold | ||||
1914
| Party | Candidate | Votes | % | |
|---|---|---|---|---|
| Republican | Everis A. Hayes (incumbent) | 36,499 | 49.1 | |
| Progressive | Lewis Dan Bohnett | 33,706 | 45.3 | |
| Prohibition | Joseph Merritt Horton | 4,157 | 5.6 | |
| Total votes | 74,362 | 100.0 | ||
| Voter turnout | % | |||
| Republican hold | ||||
1916
| Party | Candidate | Votes | % | |
|---|---|---|---|---|
| Republican | Everis A. Hayes (incumbent) | 50,659 | 68.6 | |
| Progressive | George S. Walker | 17,576 | 23.8 | |
| Socialist | Cora Pattleton Wilson | 5,564 | 7.5 | |
| Total votes | 73,799 | 100.0 | ||
| Voter turnout | % | |||
| Republican hold | ||||
1918
| Party | Candidate | Votes | % | |||
|---|---|---|---|---|---|---|
| Democratic | Hugh S. Hersman | 31,167 | 53 | |||
| Republican | Everis A. Hayes (incumbent) | 27,641 | 47 | |||
| Total votes | 58,808 | 100 | ||||
| Voter turnout | % | |||||
| Democratic gain from Republican | ||||||
1920
| Party | Candidate | Votes | % | |||
|---|---|---|---|---|---|---|
| Republican | Arthur M. Free | 46,823 | 64 | |||
| Democratic | Hugh S. Hersman (inc.) | 26,311 | 36 | |||
| Total votes | 73,134 | 100 | ||||
| Voter turnout | % | |||||
| Republican gain from Democratic | ||||||
1922
| Party | Candidate | Votes | % | |
|---|---|---|---|---|
| Republican | Arthur M. Free (incumbent) | 57,926 | 100.0 | |
| Voter turnout | % | |||
| Republican hold | ||||
1924
| Party | Candidate | Votes | % | |
|---|---|---|---|---|
| Republican | Arthur M. Free (incumbent) | 55,713 | 100.0 | |
| Voter turnout | % | |||
| Republican hold | ||||
1926
| Party | Candidate | Votes | % | |
|---|---|---|---|---|
| Republican | Arthur M. Free (incumbent) | 60,384 | 67.7 | |
| Democratic | Philip G. Sheehy | 28,836 | 32.3 | |
| Total votes | 89,220 | 100.0 | ||
| Voter turnout | % | |||
| Republican hold | ||||
1928
| Party | Candidate | Votes | % | |
|---|---|---|---|---|
| Republican | Arthur M. Free (incumbent) | 80,613 | 68 | |
| Democratic | Cecelia M. Casserly | 37,947 | 32 | |
| Total votes | 118,560 | 100 | ||
| Voter turnout | % | |||
| Republican hold | ||||
1930
| Party | Candidate | Votes | % | |
|---|---|---|---|---|
| Republican | Arthur M. Free (incumbent) | 93,377 | 100.0 | |
| Voter turnout | % | |||
| Republican hold | ||||
1932
| Party | Candidate | Votes | % | |||
|---|---|---|---|---|---|---|
| Democratic | John J. McGrath | 65,455 | 56.9 | |||
| Republican | Arthur M. Free (incumbent) | 49,487 | 43.1 | |||
| Total votes | 114,942 | 100.0 | ||||
| Voter turnout | % | |||||
| Democratic gain from Republican | ||||||
1934
| Party | Candidate | Votes | % | |
|---|---|---|---|---|
| Democratic | John J. McGrath (incumbent) | 107,325 | 100.0 | |
| Voter turnout | % | |||
| Democratic hold | ||||
1936
| Party | Candidate | Votes | % | |
|---|---|---|---|---|
| Democratic | John J. McGrath (incumbent) | 78,557 | 57.6 | |
| Republican | Alonzo L. Baker | 57,808 | 43.4 | |
| Total votes | 136,365 | 100.0 | ||
| Voter turnout | % | |||
| Democratic hold | ||||
1938
| Party | Candidate | Votes | % | |||
|---|---|---|---|---|---|---|
| Republican | Jack Z. Anderson | 84,084 | 55 | |||
| Democratic | John J. McGrath (incumbent) | 68,681 | 45 | |||
| Total votes | 152,765 | 100 | ||||
| Voter turnout | % | |||||
| Republican gain from Democratic | ||||||
1940
| Party | Candidate | Votes | % | |
|---|---|---|---|---|
| Republican | Jack Z. Anderson (inc.) | 148,180 | 96.7 | |
| Communist | Elizabeth Nichols | 5,186 | 3.3 | |
| Democratic | John J. McGrath (write-in) | 37 | 0.1 | |
| Total votes | 153,403 | 100.0 | ||
| Voter turnout | % | |||
| Republican hold | ||||
1942
| Party | Candidate | Votes | % | |
|---|---|---|---|---|
| Republican | Jack Z. Anderson (inc.) | 91,536 | 99.9 | |
| Communist | Elizabeth Nichols (write-in) | 102 | 0.1 | |
| Total votes | 91,638 | 100.0 | ||
| Voter turnout | % | |||
| Republican hold | ||||
1944
| Party | Candidate | Votes | % | |
|---|---|---|---|---|
| Republican | Jack Z. Anderson (inc.) | 94,218 | 56.5 | |
| Democratic | Arthur L. Johnson | 72,420 | 43.5 | |
| Total votes | 166,638 | 100.0 | ||
| Voter turnout | % | |||
| Republican hold | ||||
1946
| Party | Candidate | Votes | % | |
|---|---|---|---|---|
| Republican | Jack Z. Anderson (inc.) | 113,325 | 100.0 | |
| Voter turnout | % | |||
| Republican hold | ||||
1948
| Party | Candidate | Votes | % | |
|---|---|---|---|---|
| Republican | Jack Z. Anderson (inc.) | 161,743 | 79.9 | |
| Progressive | Paul Taylor | 40,670 | 20.1 | |
| Total votes | 202,413 | 100.0 | ||
| Voter turnout | % | |||
| Republican hold | ||||
1950
| Party | Candidate | Votes | % | |
|---|---|---|---|---|
| Republican | Jack Z. Anderson (inc.) | 168,510 | 83.1 | |
| Progressive | John A. Peterson | 34,176 | 16.9 | |
| Total votes | 202,686 | 100.0 | ||
| Voter turnout | % | |||
| Republican hold | ||||
1952
| Party | Candidate | Votes | % | |
|---|---|---|---|---|
| Democratic | George P. Miller (incumbent) | 156,445 | 100.0 | |
| Voter turnout | % | |||
| Democratic hold | ||||
1954
| Party | Candidate | Votes | % | |
|---|---|---|---|---|
| Democratic | George P. Miller (incumbent) | 101,803 | 65.4 | |
| Republican | Jessie M. Ritchie | 53,869 | 34.6 | |
| Total votes | 155,672 | 100.0 | ||
| Voter turnout | % | |||
| Democratic hold | ||||
1956
| Party | Candidate | Votes | % | |
|---|---|---|---|---|
| Democratic | George P. Miller (incumbent) | 136,720 | 65.6 | |
| Republican | Robert Lee Watkins | 71,700 | 34.4 | |
| Total votes | 208,420 | 100.0 | ||
| Voter turnout | % | |||
| Democratic hold | ||||
1958
| Party | Candidate | Votes | % | |
|---|---|---|---|---|
| Democratic | George P. Miller (incumbent) | 181,437 | 100.0 | |
| Voter turnout | % | |||
| Democratic hold | ||||
1960
| Party | Candidate | Votes | % | |
|---|---|---|---|---|
| Democratic | George P. Miller (incumbent) | 152,476 | 62 | |
| Republican | Robert E. Hannon | 93,403 | 38 | |
| Total votes | 245,879 | 100 | ||
| Voter turnout | % | |||
| Democratic hold | ||||
1962
| Party | Candidate | Votes | % | |
|---|---|---|---|---|
| Democratic | George P. Miller (incumbent) | 97,014 | 72.5 | |
| Republican | Harold Petersen | 36,810 | 27.5 | |
| Total votes | 133,824 | 100.0 | ||
| Voter turnout | % | |||
| Democratic hold | ||||
1964
| Party | Candidate | Votes | % | |
|---|---|---|---|---|
| Democratic | George P. Miller (incumbent) | 108,771 | 70.3 | |
| Republican | Donald E. McKay | 46,063 | 29.7 | |
| Total votes | 154,834 | 100.0 | ||
| Voter turnout | % | |||
| Democratic hold | ||||
1966
| Party | Candidate | Votes | % | |
|---|---|---|---|---|
| Democratic | George P. Miller (incumbent) | 92,263 | 65.4 | |
| Republican | Raymond P. Britton | 48,727 | 34.6 | |
| Total votes | 140,990 | 100.0 | ||
| Voter turnout | % | |||
| Democratic hold | ||||
1968
| Party | Candidate | Votes | % | |
|---|---|---|---|---|
| Democratic | George P. Miller (incumbent) | 104,231 | 64 | |
| Republican | Raymond P. Britton | 58,584 | 36 | |
| Total votes | 162,815 | 100 | ||
| Voter turnout | % | |||
| Democratic hold | ||||
1970
| Party | Candidate | Votes | % | |
|---|---|---|---|---|
| Democratic | George P. Miller (incumbent) | 104,311 | 69 | |
| Republican | Michael A. Crane | 46,872 | 31 | |
| Total votes | 151,183 | 100 | ||
| Voter turnout | % | |||
| Democratic hold | ||||
1972
| Party | Candidate | Votes | % | |
|---|---|---|---|---|
| Democratic | Pete Stark | 101,024 | 52.9 | |
| Republican | Lew M. Warden, Jr. | 89,948 | 47.1 | |
| Total votes | 190,972 | 100.0 | ||
| Voter turnout | % | |||
| Democratic hold | ||||
1974
| Party | Candidate | Votes | % | |
|---|---|---|---|---|
| Democratic | Ron Dellums (incumbent) | 93,106 | 56.6 | |
| Republican | Jack Redden | 65,432 | 39.6 | |
| American Independent | John Holland | 6,324 | 3.8 | |
| Total votes | 164,862 | 100.0 | ||
| Voter turnout | % | |||
| Democratic hold | ||||
1976
| Party | Candidate | Votes | % | |
|---|---|---|---|---|
| Democratic | Ron Dellums (incumbent) | 122,342 | 62.1 | |
| Republican | Philip Stiles Breck Jr. | 68,374 | 34.7 | |
| Peace and Freedom | Robert J. Evans | 6,238 | 3.2 | |
| Total votes | 196,954 | 100.0 | ||
| Voter turnout | % | |||
| Democratic hold | ||||
1978
| Party | Candidate | Votes | % | |
|---|---|---|---|---|
| Democratic | Ron Dellums (incumbent) | 94,824 | 57.4 | |
| Republican | Charles V. Hughes | 70,481 | 42.6 | |
| Total votes | 165,305 | 100.0 | ||
| Voter turnout | % | |||
| Democratic hold | ||||
1980
| Party | Candidate | Votes | % | |
|---|---|---|---|---|
| Democratic | Ron Dellums (incumbent) | 108,380 | 55.5 | |
| Republican | Charles V. Hughes | 76,580 | 39.2 | |
| Libertarian | Tod Mikuriya | 10,465 | 5.4 | |
| Total votes | 195,425 | 100.0 | ||
| Voter turnout | % | |||
| Democratic hold | ||||
1982
| Party | Candidate | Votes | % | |
|---|---|---|---|---|
| Democratic | Ron Dellums (incumbent) | 121,537 | 55.9 | |
| Republican | Claude B. Hutchinson Jr. | 95,694 | 44.1 | |
| Total votes | 217,231 | 100.0 | ||
| Voter turnout | % | |||
| Democratic hold | ||||
1984
| Party | Candidate | Votes | % | |
|---|---|---|---|---|
| Democratic | Ron Dellums (incumbent) | 144,316 | 60.3 | |
| Republican | Charles Connor | 94,907 | 39.7 | |
| Total votes | 239,223 | 100.0 | ||
| Voter turnout | % | |||
| Democratic hold | ||||
1986
| Party | Candidate | Votes | % | |
|---|---|---|---|---|
| Democratic | Ron Dellums (incumbent) | 121,790 | 60.0 | |
| Republican | Steven Eigenberg | 76,850 | 37.9 | |
| Peace and Freedom | Lawrence R. Manuel | 4,295 | 2.1 | |
| Total votes | 202,935 | 100.0 | ||
| Voter turnout | % | |||
| Democratic hold | ||||
1988
| Party | Candidate | Votes | % | |
|---|---|---|---|---|
| Democratic | Ron Dellums (incumbent) | 163,221 | 66.6 | |
| Republican | John J. Cuddihy, Jr. | 76,531 | 31.2 | |
| Peace and Freedom | Tom Condit | 5,444 | 2.2 | |
| Total votes | 245,196 | 100.0 | ||
| Voter turnout | % | |||
| Democratic hold | ||||
1990
| Party | Candidate | Votes | % | |
|---|---|---|---|---|
| Democratic | Ron Dellums (incumbent) | 119,645 | 61.3 | |
| Republican | Barbara Galewski | 75,544 | 38.7 | |
| Total votes | 195,189 | 100.0 | ||
| Voter turnout | % | |||
| Democratic hold | ||||
1992
| Party | Candidate | Votes | % | |
|---|---|---|---|---|
| Democratic | Nancy Pelosi (incumbent) | 191,906 | 82.5 | |
| Republican | Marc Wolin | 25,693 | 11.0 | |
| Peace and Freedom | Cesar G. Cadabes | 7,572 | 3.3 | |
| Libertarian | James R. Elwood | 7,511 | 3.2 | |
| No party | Goldwater (write-in) | 9 | 0.0% | |
| Total votes | 222,691 | 100.0 | ||
| Voter turnout | % | |||
| Democratic hold | ||||
1994
| Party | Candidate | Votes | % | |
|---|---|---|---|---|
| Democratic | Nancy Pelosi (incumbent) | 137,642 | 81.85 | |
| Republican | Elsa C. Cheung | 30,528 | 18.15 | |
| No party | Bowman (write-in) | 1 | 0.00% | |
| Total votes | 168,171 | 100.0 | ||
| Voter turnout | % | |||
| Democratic hold | ||||
1996
| Party | Candidate | Votes | % | |
|---|---|---|---|---|
| Democratic | Nancy Pelosi (incumbent) | 175,216 | 84.4 | |
| Republican | Justin Raimondo | 25,739 | 12.4 | |
| Natural Law | David Smithstein | 6,783 | 3.2 | |
| Republican | Ed Murray (write-in) | 22 | 0.0 | |
| Total votes | 207,760 | 100.0 | ||
| Voter turnout | % | |||
| Democratic hold | ||||
1998
| Party | Candidate | Votes | % | |
|---|---|---|---|---|
| Democratic | Nancy Pelosi (incumbent) | 148,027 | 85.83 | |
| Republican | David J. Martz | 20,781 | 12.05 | |
| Natural Law | David Smithstein | 6,783 | 2.12 | |
| Total votes | 175,591 | 100.0 | ||
| Voter turnout | % | |||
| Democratic hold | ||||
2000
| Party | Candidate | Votes | % | |
|---|---|---|---|---|
| Democratic | Nancy Pelosi (incumbent) | 181,847 | 84.5 | |
| Republican | Adam Sparks | 25,298 | 11.7 | |
| Libertarian | Erik Bauman | 5,645 | 2.6 | |
| Natural Law | David Smithstein | 2,638 | 1.2 | |
| Total votes | 215,428 | 100.0 | ||
| Voter turnout | % | |||
| Democratic hold | ||||
2002
| Party | Candidate | Votes | % | |
|---|---|---|---|---|
| Democratic | Nancy Pelosi (incumbent) | 127,684 | 79.6 | |
| Republican | G. Michael German | 20,063 | 12.6 | |
| Green | Jay Pond | 10,033 | 6.2 | |
| Libertarian | Ira Spivack | 2,659 | 1.6 | |
| Socialist Workers | Deborah Liatos (write-in) | 2 | 0.0 | |
| Total votes | 160,441 | 100.0 | ||
| Voter turnout | % | |||
| Democratic hold | ||||
2004
| Party | Candidate | Votes | % | |
|---|---|---|---|---|
| Democratic | Nancy Pelosi (incumbent) | 224,017 | 83.0 | |
| Republican | Jennifer Depalma | 31,074 | 11.5 | |
| Green | Leilani Dowell | 9,527 | 3.5 | |
| Green | Terry Baum (write-in) | 5,446 | 2.0 | |
| Total votes | 270,064 | 100.0 | ||
| Voter turnout | % | |||
| Democratic hold | ||||
2006
| Party | Candidate | Votes | % | |
|---|---|---|---|---|
| Democratic | Nancy Pelosi (incumbent) | 148,435 | 80.4 | |
| Republican | Mike DeNunzio | 19,800 | 10.8 | |
| Green | Krissy Keefer | 13,653 | 7.4 | |
| Libertarian | Philip Zimt Berg | 2,751 | 1.4 | |
| Total votes | 184,639 | 100.0 | ||
| Voter turnout | % | |||
| Democratic hold | ||||
2008
| Party | Candidate | Votes | % | |
|---|---|---|---|---|
| Democratic | Nancy Pelosi (incumbent) | 204,996 | 71.7 | |
| Independent | Cindy Sheehan | 46,118 | 16.1 | |
| Republican | Dana Walsh | 27,614 | 9.7 | |
| Libertarian | Philip Zimt Berg | 6,504 | 2.3 | |
| Total votes | 285,247 | 100.0 | ||
| Voter turnout | % | |||
| Democratic hold | ||||
2010
| Party | Candidate | Votes | % | |
|---|---|---|---|---|
| Democratic | Nancy Pelosi (incumbent) | 167,957 | 80% | |
| Republican | John Dennis | 31,711 | 15% | |
| Peace and Freedom | Gloria La Riva | 5,161 | 3% | |
| Libertarian | Philip Berg | 4,843 | 2% | |
| Total votes | 209,672 | 100% | ||
| Voter turnout | % | |||
| Democratic hold | ||||
2012
| Party | Candidate | Votes | % | |
|---|---|---|---|---|
| Republican | Paul Cook | 103,093 | 57% | |
| Republican | Gregg Imus | 76,551 | 43% | |
| Total votes | 179,644 | 100% | ||
| Republican hold | ||||
2014
| Party | Candidate | Votes | % | |
|---|---|---|---|---|
| Republican | Paul Cook (incumbent) | 77,480 | 68% | |
| Democratic | Bob Conaway | 37,056 | 32% | |
| Total votes | 114,536 | 100% | ||
| Republican hold | ||||
Historical district boundaries
Living former Members
As of April 2015, there are three former members of the U.S. House of Representatives from California's 8th congressional district that are currently living.
| Representative | Term in office | Date of birth (and age) |
|---|---|---|
| Pete Stark | 1973 - 1975 | November 11, 1931 |
| Ron Dellums | 1975 - 1993 | November 24, 1935 |
| Lynn Woolsey | 1993 - 2013 | November 3, 1937 |
See also
References
- 1 2 "California election results - 2012 election". Los Angeles Times. Retrieved February 24, 2013.
- ↑ "Maps: Final Congressional Districts". Citizens Redistricting Commission. Retrieved February 24, 2013.
- ↑ "Current Status of Commission's Final Certified District Maps". California Citizens Redistricting Commission. Retrieved February 13, 2013.
- ↑ "Partisan Voting Index Districts of the 113th Congress: 2004 & 2008" (PDF). The Cook Political Report. Retrieved February 13, 2013.
- ↑ "California Election Results, Nov. 6th, 2012". Los Angeles Times. Retrieved February 14, 2013.
- ↑ Statement of Vote (2000 President)
- ↑ Statement of Vote (2000 Senator)
- ↑ Statement of Vote (2002 Governor)
- ↑ Statement of Vote (2003 Recall Question)
- ↑ Statement of Vote (2003 Governor)
- ↑ Statement of Vote (2004 President)
- ↑ Statement of Vote (2004 Senator)
- ↑ Statement of Vote (2006 Governor)
- ↑ Statement of Vote (2006 Senator)
- ↑ (2008 President)
- ↑ 1920 election results
- ↑ 1922 election results
- ↑ 1924 election results
- ↑ 1926 election results
- ↑ 1928 election results
- ↑ 1930 election results
- ↑ 1932 election results
- ↑ 1934 election results
- ↑ 1936 election results
- ↑ 1938 election results
- ↑ 1940 election results
- ↑ 1942 election results
- ↑ 1944 election results
- ↑ 1946 election results
- ↑ 1948 election results
- ↑ 1950 election results
- ↑ 1952 election results
- ↑ 1954 election results
- ↑ 1956 election results
- ↑ 1958 election results
- ↑ 1960 election results
- ↑ 1962 election results
- ↑ 1964 election results
- ↑ 1966 election results
- ↑ 1968 election results
- ↑ 1970 election results
- ↑ 1972 election results
- ↑ 1974 election results
- ↑ 1976 election results
- ↑ 1978 election results
- ↑ 1980 election results
- ↑ 1982 election results
- ↑ 1984 election results
- ↑ 1986 election results
- ↑ 1988 election results
- ↑ 1990 election results
- ↑ 1992 election results
- ↑ 1994 election results
- ↑ 1996 election results
- ↑ 1998 election results
- ↑ 2000 election results
- ↑ 2002 general election results Archived February 3, 2009, at the Wayback Machine.
- ↑ 2004 general election results
- ↑ 2006 general election results Archived November 27, 2008, at the Wayback Machine.
- ↑ 2008 general election results
- ↑ "House Results Map". The New York Times.
- 1 2 2012 general election results Archived October 19, 2013, at the Wayback Machine.
External links
- GovTrack.us: California's 8th congressional district
- RAND California Election Returns: District Definitions (out of date)
- California Voter Foundation map — CD08 (out of date)
| United States House of Representatives | ||
|---|---|---|
| Preceded by Illinois's 14th congressional district |
Home district of the Speaker of the House January 4, 2007–January 3, 2011 |
Succeeded by Ohio's 8th congressional district |
Coordinates: 36°06′N 117°18′W / 36.1°N 117.3°W