Camotán
| Camotán | |
|---|---|
| Municipality | |
 Camotán | |
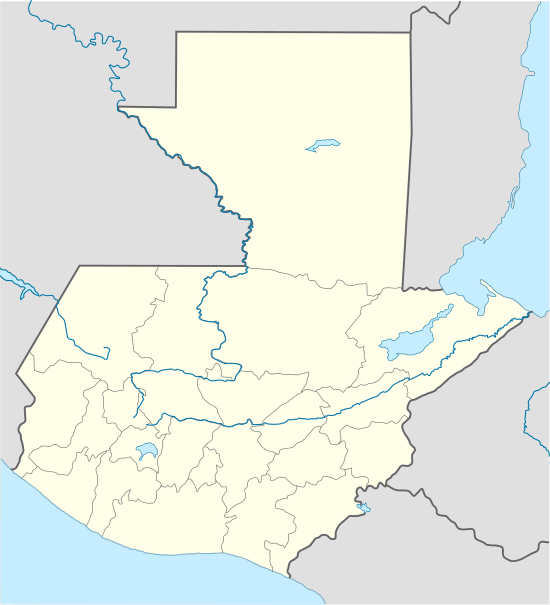
| Coordinates: 14°49′0″N 89°22′54″W / 14.81667°N 89.38167°WCoordinates: 14°49′0″N 89°22′54″W / 14.81667°N 89.38167°W | |
| Country |
|
| Department |
|
| Government[1] | |
| • Type | Municipal |
| • Mayor (2016-2020) | Guillermo Guerra |
| Area | |
| • Total | 232 km2 (90 sq mi) |
| Population (2002 census)[2] | |
| • Total | 36,226 |
| Time zone | Central (CST) (UTC-6) |
| • Summer (DST) | CDT (UTC-5) |
| Climate | Aw |
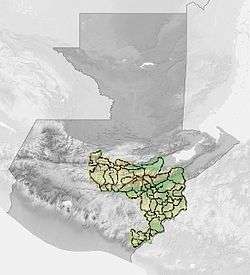
Camotán is a municipality in the Chiquimula department of Guatemala.
History
2001 famine
«If 80% of the population in Guatemala lives in poverty, with that percent, I do not know what is the big fuss about this famine.
President Alfonso Portillo, 2001[3]
On 3 August 2001, Camotán municipality declared yellow code in the area when it learned about the desperate situation that the rural communities were facing, facing imminent famine; the root cause of the crisis were the short raining season, and the decline in the international coffee price.[3] Alfonso Portillo's government decreed State of Calamity to get international help; officially, 48 deceased were reported, but there were rumors of hundreds of casualties.[3]
Population
Total population as of 2002 was 35,263, living in 6,479 homes.
| Village | Population | Village | Population |
|---|---|---|---|
| Lelá Chancó | 2272 | Tesoro | 2051 |
| El Guayabo | 1804 | Rodeo | 1721 |
| Nearar | 1682 | Tisipe | 1557 |
| El Volcán | 1549 | El Limón | 1544 |
| Shalaguá | 1529 | Lantiquin | 1453 |
| Shupá | 1388 | Lelá Obraje | 1337 |
| Guior | 1167 | Pajcó | 1154 |
Climate
Camotán has a tropical savanna climate (Köppen: Aw).
| Climate data for Camotán | |||||||||||||
|---|---|---|---|---|---|---|---|---|---|---|---|---|---|
| Month | Jan | Feb | Mar | Apr | May | Jun | Jul | Aug | Sep | Oct | Nov | Dec | Year |
| Average high °C (°F) | 29.2 (84.6) |
30.6 (87.1) |
33.2 (91.8) |
33.9 (93) |
33.6 (92.5) |
31.5 (88.7) |
31.9 (89.4) |
31.3 (88.3) |
30.7 (87.3) |
30.2 (86.4) |
29.2 (84.6) |
28.6 (83.5) |
31.16 (88.1) |
| Daily mean °C (°F) | 23.5 (74.3) |
24.6 (76.3) |
26.5 (79.7) |
27.4 (81.3) |
27.5 (81.5) |
26.2 (79.2) |
25.9 (78.6) |
25.9 (78.6) |
25.6 (78.1) |
25.2 (77.4) |
24.1 (75.4) |
23.4 (74.1) |
25.48 (77.88) |
| Average low °C (°F) | 17.9 (64.2) |
18.6 (65.5) |
19.9 (67.8) |
21.0 (69.8) |
21.4 (70.5) |
20.9 (69.6) |
20.9 (69.6) |
20.6 (69.1) |
20.6 (69.1) |
20.2 (68.4) |
19.1 (66.4) |
18.3 (64.9) |
19.95 (67.91) |
| Average precipitation mm (inches) | 4 (0.16) |
4 (0.16) |
7 (0.28) |
17 (0.67) |
94 (3.7) |
202 (7.95) |
149 (5.87) |
150 (5.91) |
186 (7.32) |
93 (3.66) |
23 (0.91) |
11 (0.43) |
940 (37.02) |
| Source: Climate-Data.org[4] | |||||||||||||
Geographic location
 |
La Unión, Zacapa Department municipality | | ||
| Jocotán, Chiquimula Department municipality | |
Copán, | ||
| ||||
| | ||||
| Esquipulas, Chiquimula Department municipality[5] |
See also
-
 Guatemala portal
 -
 Geography portal
 - List of places in Guatemala
Notes and references
References
- ↑ "Alcaldes electos en el departamento de Chiquimula". Municipalidades de Guatemala (in Spanish). Guatemala. Archived from the original on October 20, 2015. Retrieved 20 October 2015.
- ↑ "XI Censo Nacional de Poblacion y VI de Habitación (Censo 2002)" (in Spanish). Instituto Nacional de Estadística (INE). 2002.
- 1 2 3 "La hambruna y la sequía golpean a Guatemala: ya hay 48 muertos". Industriall global union (in Spanish). 14 September 2001. Archived from the original on October 20, 2015.
- ↑ "Climate: Camotán". Climate-Data.org. Retrieved 19 October 2015.
- 1 2 SEGEPLAN. "Municipios del departamento de Chiquimula". Secretaría de Planificación y Programación de la Presidencia (in Spanish). Guatemala. Archived from the original on July 7, 2015. Retrieved 20 October 2015.
Capital: Chiquimula | ||
| Municipalities |  | |