Canadian federal election, 1904
| | |||||||||||||||||||||||||||||||||||||||||||||||
| |||||||||||||||||||||||||||||||||||||||||||||||
| |||||||||||||||||||||||||||||||||||||||||||||||
|
| |||||||||||||||||||||||||||||||||||||||||||||||
| |||||||||||||||||||||||||||||||||||||||||||||||

The Canadian federal election of 1904 was held on November 3 to elect members of the Canadian House of Commons of the 10th Parliament of Canada. Prime Minister Sir Wilfrid Laurier led the Liberal Party of Canada to a third term in government, with an increased majority, and over half of the popular vote.
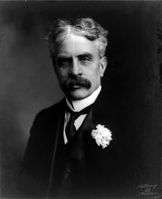
Sir Robert Borden's Conservatives and Liberal-Conservatives were unable to challenge the Liberals effectively, and lost a small portion of their popular vote, along with four seats, including his own. Borden re-entered parliament the next year in a by-election.
Voter turnout: 71.6%.[1]
National results
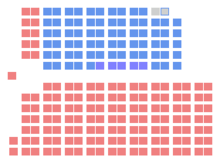
The Canadian parliament after the 1904 election
| ↓ | ||||
| 137 | 75 | 2 | ||
| Liberal | Conservative | O | ||
| Party | Party leader | # of candidates |
Seats | Popular vote | |||||
|---|---|---|---|---|---|---|---|---|---|
| 1900 | Elected | Change | # | % | Change | ||||
| Liberal | Wilfrid Laurier | 208 | 128 | 137 | +7.0% | 521,041 | 50.88% | +0.63pp | |
| Conservative | Robert Borden | 199 | 69 | 70 | +1.4% | 454 693 | 44.40% | +1.18pp | |
| Liberal-Conservative | 6 | 10 | 5 | -50.0% | 15,737 | 1.54% | -1.34pp | ||
| Independent | 6 | 3 | 1 | -66.7% | 10,205 | 1.45% | -0.40pp | ||
| Independent Conservative | 2 | 1 | 1 | - | 5,039 | 0.49% | -0.57pp | ||
| Unknown | 13 | - | - | - | 11,659 | 1.14% | +1.14pp | ||
| Labour | 2 | - | - | - | 2,159 | 0.21% | -0.10pp | ||
| Socialist | 3 | * | - | * | 1,794 | 0.18% | * | ||
| Nationalist | 1 | * | - | * | 1,429 | 0.14% | * | ||
| Independent Liberal | 3 | 1 | - | -100% | 309 | 0.03% | -0.48pp | ||
| Total | 443 | 213 | 214 | +0.5% | 1,024,065 | 100% | |||
| Sources: http://www.elections.ca -- History of Federal Ridings since 1867 | |||||||||
Note:
* Party did not nominate candidates in the previous election.
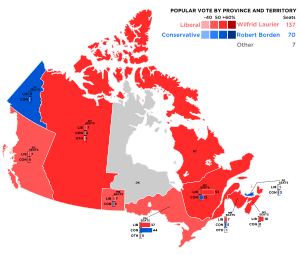
Results by province
| Party | BC | NW | MB | ON | QC | NB | NS | PE | YK | Total | |||
|---|---|---|---|---|---|---|---|---|---|---|---|---|---|
| Liberal | Seats: | 7 | 7 | 7 | 37 | 53 | 7 | 18 | 1 | - | 137 | ||
| Popular Vote (%): | 49.5 | 58.4 | 49.7 | 47.5 | 55.1 | 51.0 | 52.9 | 49.1 | 41.4 | 50.9 | |||
| Conservative | Seats: | - | 2 | 3 | 44 | 12 | 5 | - | 3 | 1 | 70 | ||
| Vote (%): | 38.8 | 37.8 | 41.8 | 46.3 | 43.0 | 42.0 | 44.5 | 50.9 | 58.6 | 44.4 | |||
| Liberal-Conservative | Seats: | 1 | 3 | 1 | 5 | ||||||||
| Vote (%): | 3.8 | 2.1 | 6.8 | 1.5 | |||||||||
| Independent | Seats: | - | - | 1 | - | - | 1 | ||||||
| Vote (%): | xx | 5.8 | 0.6 | 1.3 | 1.6 | 1.0 | |||||||
| Independent Conservative | Seats: | 1 | 1 | ||||||||||
| Vote (%): | 1.2 | 0.5 | |||||||||||
| Total seats | 7 | 10 | 10 | 86 | 65 | 13 | 18 | 4 | 1 | 214 | |||
| Parties that won no seats: | |||||||||||||
| Unknown | Vote (%): | 4.6 | 2.4 | xx | 1.1 | ||||||||
| Labour | Vote (%): | 2.7 | 0.7 | 0.8 | 0.2 | ||||||||
| Socialist | Vote (%): | 7.1 | 0.2 | ||||||||||
| Nationalist | Vote (%): | 0.6 | 0.5 | ||||||||||
| Independent Liberal | Vote (%): | xx | 0.2 | 0.1 | xx | ||||||||
xx - indicates less than 0.05% of the popular vote.
Vote and seat summaries
See also
- List of Canadian federal general elections
- List of political parties in Canada
- 10th Canadian Parliament
References
This article is issued from Wikipedia - version of the 11/17/2016. The text is available under the Creative Commons Attribution/Share Alike but additional terms may apply for the media files.