Darlington (UK Parliament constituency)
Coordinates: 54°31′44″N 1°33′11″W / 54.529°N 1.553°W
| Darlington | |
|---|---|
|
Borough constituency for the House of Commons | |
|
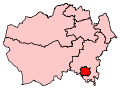
Boundary of Darlington in County Durham. | |
|
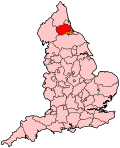
Location of County Durham within England. | |
| County | County Durham |
| Electorate | 67,476 (December 2010)[1] |
| Major settlements | Darlington |
| Current constituency | |
| Created | 1868 |
| Member of parliament | Jenny Chapman (Labour) |
| Number of members | One |
| Overlaps | |
| European Parliament constituency | North East England |
Darlington is a market town in County Durham in the North East of England and regarded as a semi-marginal Labour seat currently represented in the House of Commons of the UK Parliament since 2010 by Jenny Chapman of the Labour Party.[n 1]
History
The constituency was created for the 1868 election[n 2] and covers the market town of Darlington in County Durham. The seat has been held by all three major parties in its long existence, but has been a marginal constituency between the Labour and Conservative parties in the years since the Second World War. Labour have held the seat since 1992 with their candidate Jenny Chapman winning the seat in 2010 with a 3,388 majority down from 10,404 in the previous election. In 2015, her majority over the Conservatives fell to 3,158.
Boundaries
The seat has electoral wards:
- Bank Top & Lascelles, Brinkburn & Faverdale, Cockerton, College, Eastbourne, Harrowgate Hill, Haughton & Springfield, Hummersknott, Mowden, Northgate, North Road, Park East, Park West, Pierremont, Red Hall & Lingfield, Stephenson and Whinfield in the Borough of Darlington
These boundaries show only a minor change from those used from 1983 to 2010.
Members of Parliament
Elections
Elections in the 2010s
| Party | Candidate | Votes | % | ± | |
|---|---|---|---|---|---|
| Labour | Jenny Chapman | 17,637 | 42.9 | +3.5 | |
| Conservative | Peter Cuthbertson[5] | 14,479 | 35.2 | +3.7 | |
| UKIP | David Hodgson[6] | 5,392 | 13.1 | +10.3 | |
| Liberal Democrat | Anne-Marie Curry[7] | 1,966 | 4.8 | -18.6 | |
| Green | Michael Cherrington[8] | 1,444 | 3.5 | N/A | |
| TUSC | Alan Docherty [9] | 223 | 0.5 | N/A | |
| Majority | 3,158 | 7.7 | -0.2 | ||
| Turnout | 41,141 | 62.5 | +0.6 | ||
| Labour hold | Swing | −0.1 | |||
In the 2015 election, 89 ballot papers were issued omitting the UKIP candidate before the error was corrected.[10]
| Party | Candidate | Votes | % | ± | |
|---|---|---|---|---|---|
| Labour | Jenny Chapman | 16,891 | 39.4 | −13.0 | |
| Conservative | Edward Legard | 13,503 | 31.5 | +5.5 | |
| Liberal Democrat | Mike Barker | 10,046 | 23.4 | +4.9 | |
| BNP | Amanda Foster | 1,262 | 2.9 | N/A | |
| UKIP | Charlotte Bull | 1,194 | 2.8 | +0.9 | |
| Majority | 3,388 | 7.9 | |||
| Turnout | 42,896 | 61.9 | +1.6 | ||
| Labour hold | Swing | −9.2 | |||
Elections in the 2000s
| Party | Candidate | Votes | % | ± | |
|---|---|---|---|---|---|
| Labour | Alan Milburn | 20,643 | 52.4 | −3.9 | |
| Conservative | Anthony Frieze | 10,239 | 26.0 | −4.3 | |
| Liberal Democrat | Robert Adamson | 7,269 | 18.5 | +7.6 | |
| UKIP | John Hoodless | 730 | 1.9 | N/A | |
| Veritas | David Davies | 507 | 1.3 | N/A | |
| Majority | 10,404 | 26.4 | |||
| Turnout | 39,388 | 60.3 | −1.7 | ||
| Labour hold | Swing | +0.2 | |||
| Party | Candidate | Votes | % | ± | |
|---|---|---|---|---|---|
| Labour | Alan Milburn | 22,479 | 56.3 | −5.2 | |
| Conservative | Tony Richmond | 12,095 | 30.3 | +2.0 | |
| Liberal Democrat | Robert Adamson | 4,358 | 10.9 | +3.7 | |
| Socialist Alliance | Alan Docherty | 469 | 1.2 | N/A | |
| Independent | Craig Platt | 269 | 0.7 | N/A | |
| Socialist Labour | Amanda Rose | 229 | 0.6 | N/A | |
| Majority | 10,384 | 26.0 | |||
| Turnout | 39,899 | 62.0 | −11.9 | ||
| Labour hold | Swing | −3.6 | |||
Elections in the 1990s
| Party | Candidate | Votes | % | ± | |
|---|---|---|---|---|---|
| Labour | Alan Milburn | 29,658 | 61.6 | +13.5 | |
| Conservative | Peter Scrope | 13,633 | 28.3 | −14.7 | |
| Liberal Democrat | Leslie Boxell | 3,483 | 7.2 | −1.1 | |
| Referendum | Michael Blakey | 1,399 | 2.9 | N/A | |
| Majority | 16,025 | 33.3 | |||
| Turnout | 48,172 | 73.9 | |||
| Labour hold | Swing | ||||
| Party | Candidate | Votes | % | ± | |
|---|---|---|---|---|---|
| Labour | Alan Milburn | 26,556 | 48.1 | +6.5 | |
| Conservative | Michael Cathel Fallon | 23,758 | 43.0 | −3.6 | |
| Liberal Democrat | Peter John Bergg | 4,586 | 8.3 | −3.5 | |
| BNP | Dr. Donald Clarke | 355 | 0.6 | N/A | |
| Majority | 2,798 | 5.1 | +0.1 | ||
| Turnout | 55,255 | 83.6 | +2.8 | ||
| Labour gain from Conservative | Swing | +5.0 | |||
Elections in the 1980s
| Party | Candidate | Votes | % | ± | |
|---|---|---|---|---|---|
| Conservative | Michael Cathel Fallon | 24,831 | 46.6 | +2.0 | |
| Labour | Oswald O'Brien | 22,170 | 41.6 | +3.8 | |
| Liberal | Andrew Collinge | 6,289 | 11.8 | ||
| Majority | 2,661 | 5.0 | |||
| Turnout | 53,290 | 80.8 | |||
| Conservative hold | Swing | ||||
| Party | Candidate | Votes | % | ± | |
|---|---|---|---|---|---|
| Conservative | Michael Cathel Fallon | 22,434 | 44.6 | ||
| Labour | Oswald O'Brien | 18,996 | 37.8 | ||
| Social Democratic | Ray Dutton | 8,737 | 17.4 | ||
| Christian Democratic Party | A.H. Clark | 108 | 0.2 | ||
| Majority | 3,438 | 6.8 | |||
| Turnout | 50,275 | 80.8 | |||
| Conservative gain from Labour | Swing | ||||
| Party | Candidate | Votes | % | ± | |
|---|---|---|---|---|---|
| Labour | Oswald O'Brien | 20,544 | 39.5 | −6.0 | |
| Conservative | Michael Fallon | 18,132 | 34.9 | −8.5 | |
| Social Democratic | Anthony Cook | 12,735 | 24.5 | +14.3 | |
| Monster Raving Loony | Screaming Lord Sutch | 374 | 0.7 | N/A | |
| Independent | Arthur Clark | 164 | 0.3 | N/A | |
| Tactical Voting Annihilates Bennite Tatchellites | Thomas Keen | 27 | 0.1 | N/A | |
| Yoga and Meditation | Jitendra Bardwaj | 15 | 0.0 | N/A | |
| Republican | Peter Smith | 10 | 0.0 | N/A | |
| Majority | 2,412 | 4.6 | +2.5 | ||
| Turnout | 52,001 | ||||
| Labour hold | Swing | +1.25 | |||
Elections in the 1970s
| Party | Candidate | Votes | % | ± | |
|---|---|---|---|---|---|
| Labour | Edward Joseph Fletcher | 22,565 | 45.52 | +0.0 | |
| Conservative | Timothy Kirkhope | 21,513 | 43.39 | +5.8 | |
| Liberal | K. Walker | 5,054 | 10.19 | −6.4 | |
| National Front | H. Outhwaite | 444 | 0.90 | N/A | |
| Majority | 1,052 | 2.12 | −5.8 | ||
| Turnout | 49,576 | 78.4 | +13.4 | ||
| Labour hold | Swing | −2.82 | |||
| Party | Candidate | Votes | % | ± | |
|---|---|---|---|---|---|
| Labour | Edward Joseph Fletcher | 21,334 | 45.55 | ||
| Conservative | Brian Hord | 17,620 | 37.62 | ||
| Liberal | Philip Frietag | 7,882 | 16.83 | ||
| Majority | 3,714 | 7.93 | |||
| Turnout | 46,836 | 74.40 | |||
| Labour hold | Swing | ||||
| Party | Candidate | Votes | % | ± | |
|---|---|---|---|---|---|
| Labour | Edward Joseph Fletcher | 20,546 | 40.75 | ||
| Conservative | Brian Hord | 18,477 | 36.65 | ||
| Liberal | Philip Frietag | 11,398 | 22.61 | ||
| Majority | 2,069 | 4.10 | |||
| Turnout | 50,421 | 80.78 | |||
| Labour hold | Swing | ||||
| Party | Candidate | Votes | % | ± | |
|---|---|---|---|---|---|
| Labour | Edward Joseph Fletcher | 23,208 | 48.47 | ||
| Conservative | Anthony Temple Bourne-Arton | 19,447 | 40.62 | ||
| Liberal | Stuart S. Newton | 5,222 | 10.91 | ||
| Majority | 3,761 | 7.86 | |||
| Turnout | 47,877 | 76.44 | |||
| Labour hold | Swing | ||||
Elections in the 1960s
| Party | Candidate | Votes | % | ± | |
|---|---|---|---|---|---|
| Labour | Edward Joseph Fletcher | 23,909 | 50.50 | ||
| Conservative | Anthony Temple Bourne-Arton | 19,546 | 41.28 | ||
| Liberal | Robert Oakeshott | 3,891 | 8.22 | ||
| Majority | 4,363 | 9.22 | |||
| Turnout | 47,346 | 82.26 | |||
| Labour hold | Swing | ||||
| Party | Candidate | Votes | % | ± | |
|---|---|---|---|---|---|
| Labour | Edward Joseph Fletcher | 21,751 | 45.15 | ||
| Conservative | Anthony Temple Bourne-Arton | 19,841 | 41.19 | ||
| Liberal | Joseph Gurney Pease | 6,578 | 13.66 | ||
| Majority | 1,910 | 3.97 | |||
| Turnout | 48,170 | 82.98 | |||
| Labour gain from Conservative | Swing | ||||
Elections in the 1950s
| Party | Candidate | Votes | % | ± | |
|---|---|---|---|---|---|
| Conservative | Anthony Temple Bourne-Arton | 24,318 | 48.56 | ||
| Labour | Ronald Howard Lewis | 19,901 | 39.74 | ||
| Liberal | John Patrick McQuade | 5,863 | 11.71 | ||
| Majority | 4,417 | 8.82 | |||
| Turnout | 84.40 | ||||
| Conservative hold | Swing | ||||
| Party | Candidate | Votes | % | ± | |
|---|---|---|---|---|---|
| Conservative | Frederick Fergus Graham | 25,765 | 52.64 | ||
| Labour | Arnold John Parkinson | 23,184 | 47.36 | ||
| Majority | 2,581 | 5.27 | |||
| Turnout | 82.34 | ||||
| Conservative hold | Swing | ||||
| Party | Candidate | Votes | % | ± | |
|---|---|---|---|---|---|
| Conservative | Frederick Fergus Graham | 26,858 | 50.77 | ||
| Labour | David Rennie Hardman | 26,045 | 49.23 | ||
| Majority | 813 | 1.54 | |||
| Turnout | 87.11 | ||||
| Conservative gain from Labour | Swing | ||||
| Party | Candidate | Votes | % | ± | |
|---|---|---|---|---|---|
| Labour | David Rennie Hardman | 23,528 | 44.78 | ||
| Conservative | Geraldyne Edith Mary Walford | 17,421 | 33.16 | ||
| Liberal | Gordon Victor Rogers | 11,588 | 22.06 | ||
| Majority | 6,107 | 11.62 | |||
| Turnout | 88.48 | ||||
| Labour hold | Swing | ||||
Election in the 1940s
| Party | Candidate | Votes | % | ± | |
|---|---|---|---|---|---|
| Labour | David Rennie Hardman | 21,442 | 48.91 | ||
| Conservative | Charles Urie Peat | 13,153 | 30.02 | ||
| Liberal | Gordon Victor Rogers | 9,215 | 21.03 | ||
| Majority | 8,289 | 18.92 | |||
| Turnout | 80.09 | ||||
| Labour gain from Conservative | Swing | ||||
Elections in the 1930s
| Party | Candidate | Votes | % | ± | |
|---|---|---|---|---|---|
| Conservative | Charles Urie Peat | 22,320 | 55.21 | ||
| Labour | Arthur Lewis Shepherd | 18,105 | 44.79 | ||
| Majority | 4,215 | 10.43 | |||
| Turnout | 84.79 | ||||
| Conservative hold | Swing | ||||
| Party | Candidate | Votes | % | ± | |
|---|---|---|---|---|---|
| Conservative | Charles Urie Peat | 24,416 | 60.72 | ||
| Labour | Arthur Lewis Shepherd | 15,798 | 39.28 | ||
| Majority | 8,618 | 21.43 | |||
| Turnout | 89.47 | ||||
| Conservative gain from Labour | Swing | ||||
Elections in the 1920s
| Party | Candidate | Votes | % | ± | |
|---|---|---|---|---|---|
| Labour | Arthur Lewis Shepherd | 17,061 | 44.0 | -0.5 | |
| Unionist | Viscount Castlereagh | 15,596 | 40.2 | -3.1 | |
| Liberal | John Joseph Richardson | 6,149 | 15.8 | +3.6 | |
| Majority | 1,465 | 3.8 | +2.6 | ||
| Turnout | 89.6 | +2.0 | |||
| Labour hold | Swing | +1.3 | |||
| Party | Candidate | Votes | % | ± | |
|---|---|---|---|---|---|
| Labour | Arthur Lewis Shepherd | 12,965 | 44.5 | −1.7 | |
| Unionist | E. H. Pease | 12,636 | 43.3 | −10.5 | |
| Liberal | John Purcell Dickie | 3,573 | 12.2 | N/A | |
| Majority | 329 | 1.2 | N/A | ||
| Turnout | 29,174 | 87.6 | +1.5 | ||
| Labour gain from Unionist | Swing | +4.4 | |||
| Party | Candidate | Votes | % | ± | |
|---|---|---|---|---|---|
| Unionist | William Edwin Pease | 15,174 | 53.8 | +11.6 | |
| Labour | Arthur Lewis Shepherd | 13,008 | 46.2 | +12.6 | |
| Majority | 2,166 | 7.6 | −1.0 | ||
| Turnout | 28,182 | 86.1 | −0.7 | ||
| Unionist hold | Swing | −0.5 | |||
| Party | Candidate | Votes | % | ± | |
|---|---|---|---|---|---|
| Unionist | William Edwin Pease | 11,638 | 42.2 | -14.4 | |
| Labour | William John Sherwood | 9,284 | 33.6 | -9.8 | |
| Liberal | Robert Alderson Wright | 6,697 | 24.2 | n/a | |
| Majority | 2,354 | 8.6 | -4.6 | ||
| Turnout | 86.8 | +1.5 | |||
| Unionist hold | Swing | -2.3 | |||
| Party | Candidate | Votes | % | ± | |
|---|---|---|---|---|---|
| Unionist | William Edwin Pease | 14,684 | 56.6 | +6.9 | |
| Labour | William John Sherwood | 11,271 | 43.4 | +9.6 | |
| Majority | 3,413 | 13.2 | −2.7 | ||
| Turnout | 25,955 | 85.3 | −2.7 | ||
| Unionist hold | Swing | −1.4 | |||
| Party | Candidate | Votes | % | ± | |
|---|---|---|---|---|---|
| Unionist | Herbert Pike Pease | 13,286 | 49.7 | −11.8 | |
| Labour | William John Sherwood | 9,048 | 33.8 | N/A | |
| Liberal | Thomas Crooks | 4,419 | 16.5 | −22.0 | |
| Majority | 4,238 | 15.9 | −7.1 | ||
| Turnout | 26,753 | 88.0 | +20.2 | ||
| Unionist hold | Swing | N/A | |||
Elections in the 1910s
| Party | Candidate | Votes | % | ± | |
|---|---|---|---|---|---|
| Unionist | 11,951 | 61.5 | |||
| Liberal | Alfred Henry Scott | 7,494 | 38.5 | ||
| Majority | 4,457 | 23.0 | |||
| Turnout | 67.8 | ||||
| Unionist hold | Swing | ||||
- denotes candidate who was endorsed by the Coalition Government.
See also
- List of Parliamentary constituencies in County Durham
- Darlington by-election, 1923
- Darlington by-election, 1926
- Darlington by-election, 1983
Notes and references
- Notes
- ↑ As with all constituencies, the constituency elects one Member of Parliament (MP) by the first past the post system of election at least every five years.
- ↑ 17 years before the Redistribution of Seats Act 1885 which created many more
- References
- ↑ "Electorate Figures - Boundary Commission for England". 2011 Electorate Figures. Boundary Commission for England. 4 March 2011. Retrieved 13 March 2011.
- ↑ Leigh Rayment's Historical List of MPs – Constituencies beginning with "D" (part 1)
- ↑ also known as Trebitsch Lincoln, later a spy
- ↑ "Election Data 2015". Electoral Calculus. Archived from the original on 17 October 2015. Retrieved 17 October 2015.
- ↑ http://www.thenorthernecho.co.uk/news/11415111.Conservatives_announce_Parliamentary_candidate_for_Darlington/
- ↑ http://www.thenorthernecho.co.uk/news/11755191.Darlington_UKIP_candidate_pledges_to_stop__appalling_waste__of_UK_resources/
- ↑ http://www.thenorthernecho.co.uk/election2015/11758539.Liberal_Democrats_announce_their_Darlington_candidate_for_the_General_Election/
- ↑ http://www.thenorthernecho.co.uk/business_all/11728362.Greens_name_election_candidates/?ref=rss
- ↑ http://www.tusc.org.uk/txt/320.pdf
- ↑ Election 2015, BBC, 8 May 2015
- ↑ "Election Data 2010". Electoral Calculus. Archived from the original on 26 July 2013. Retrieved 17 October 2015.
- ↑ "BBC NEWS – Election 2010 – Darlington". BBC News.
- ↑ "Election Data 2005". Electoral Calculus. Archived from the original on 15 October 2011. Retrieved 18 October 2015.
- ↑ "Election Data 2001". Electoral Calculus. Archived from the original on 15 October 2011. Retrieved 18 October 2015.
- ↑ "Election Data 1997". Electoral Calculus. Archived from the original on 15 October 2011. Retrieved 18 October 2015.
- ↑ http://www.politicsresources.net/area/uk/constit/129.htm
- ↑ "Election Data 1992". Electoral Calculus. Archived from the original on 15 October 2011. Retrieved 18 October 2015.
- ↑ "Politics Resources". Election 1992. Politics Resources. 9 April 1992. Retrieved 6 December 2010.
- ↑ "Election Data 1987". Electoral Calculus. Archived from the original on 15 October 2011. Retrieved 18 October 2015.
- ↑ "Election Data 1983". Electoral Calculus. Archived from the original on 15 October 2011. Retrieved 18 October 2015.
- ↑ British Parliamentary Election Results 1918-1949, FWS Craig
- ↑ British Parliamentary Election Results 1918-1949, FWS Craig