South Shields (UK Parliament constituency)
Coordinates: 54°58′23″N 1°24′50″W / 54.973°N 1.414°W
| South Shields | |
|---|---|
|
Borough constituency for the House of Commons | |
|
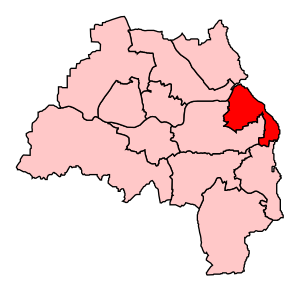
Boundary of South Shields in Tyne and Wear. | |
|
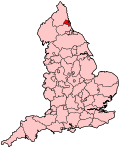
Location of Tyne and Wear within England. | |
| County | Tyne and Wear |
| Electorate | 82,294(2011)[1] |
| Current constituency | |
| Created | 1832 |
| Member of parliament | Emma Lewell-Buck |
| Number of members | One |
| Created from | County Durham |
| Overlaps | |
| European Parliament constituency | North East England |
South Shields is a borough constituency represented in the House of Commons of the Parliament of the United Kingdom. It elects one Member of Parliament (MP) by the first past the post system of election. It has been represented by Emma Lewell-Buck of the Labour Party since 2013.
Boundaries
1918-1983: The County Borough of South Shields.
1983-1997: The Metropolitan Borough of South Tyneside wards of All Saints, Beacon and Bents, Cleadon Park, Harton, Horsley Hill, Rekendyke, Tyne Dock and Simonside, Westoe, West Park, and Whiteleas.
1997-2010: The Metropolitan Borough of South Tyneside wards of All Saints, Beacon and Bents, Biddick Hall, Cleadon Park, Harton, Horsley Hill, Rekendyke, Tyne Dock and Simonside, Westoe, West Park, and Whiteleas.
2010-present: The Metropolitan Borough of South Tyneside wards of Beacon and Bents, Biddick and All Saints, Cleadon Park, Harton, Horsley Hill, Simonside and Rekendyke, Westoe, West Park, Whitburn and Marsden, and Whiteleas.
The current constituency covers the area of South Shields in the South Tyneside district of Tyne and Wear. Boundary changes at the 2010 general election transferred the community of Whitburn into the South Shields constituency from the neighbouring Jarrow seat.
Members of Parliament
The seat was held from 2001 to 2013 by David Miliband, who served as Foreign Secretary from 2007 until Labour's general election defeat of 2010. On 26 March 2013 Miliband announced his resignation from Parliament in order to take up a post as the head of the International Rescue Committee in New York City.[2]
With two exceptions (Arthur Blenkinsop and Emma Lewell-Buck) every South Shields MP since 1929 has been a cabinet member at some point in their career. Two of them, Chuter Ede (Home Secretary) and Miliband (Foreign Secretary), have held one of the great offices of state while MP for South Shields. It is the only constituency in existence since the Great Reform Act of 1832 never to have elected a Conservative MP.[4]
Elections
Elections in the 2010s
| Party | Candidate | Votes | % | ± | |
|---|---|---|---|---|---|
| Labour | Emma Lewell-Buck | 18,589 | 51.3 | −0.8 | |
| UKIP | Norman Dennis | 7,975 | 22.0 | N/A | |
| Conservative | Robert Oliver | 6,021 | 16.6 | −5.0 | |
| Green | Shirley Ford | 1,614 | 4.5 | +2.4 | |
| Independent | Lisa Nightingale | 1,427 | 3.9 | N/A | |
| Liberal Democrat | Gitanjali (Gita) Gordon | 639 | 1.8 | −12.4 | |
| Majority | 10,614 | 29.3 | −1.1 | ||
| Turnout | 36,265 | 57.8 | +0.1 | ||
| Labour hold | Swing | −11.4 | |||
| Party | Candidate | Votes | % | ± | |
|---|---|---|---|---|---|
| Labour | Emma Lewell-Buck | 12,493 | 50.4 | −1.6 | |
| UKIP | Richard Elvin | 5,988 | 24.2 | N/A | |
| Conservative | Karen Allen | 2,857 | 11.5 | −10.1 | |
| Independent | Ahmed Khan | 1,331 | 5.4 | N/A | |
| Independent Socialist Party | Phil Brown | 750 | 3.0 | N/A | |
| BNP | Lady Dorothy MacBeth Brookes | 711 | 2.9 | −3.6 | |
| Liberal Democrat | Hugh Annand | 352 | 1.4 | −12.8 | |
| Monster Raving Loony | Alan "Howling Laud" Hope | 197 | 0.8 | N/A | |
| Independent | Thomas Darwood | 57 | 0.2 | N/A | |
| Majority | 6,505 | 26.3 | -4.1 | ||
| Turnout | 24,780 | 39.3 | −18.4 | ||
| Labour hold | Swing | −12.9 | |||
| Party | Candidate | Votes | % | ± | |
|---|---|---|---|---|---|
| Labour | David Miliband | 18,995 | 52.0 | −8.8 | |
| Conservative | Karen Allen | 7,886 | 21.6 | +4.0 | |
| Liberal Democrat | Stephen Psallidas | 5,189 | 14.2 | −5.0 | |
| BNP | Donna Watson | 2,382 | 6.5 | N/A | |
| Green | Shirley Ford | 762 | 2.1 | N/A | |
| Independent | Siamak Kaikavoosi | 729 | 2.0 | N/A | |
| Independent | Victor Thomson | 316 | 0.9 | N/A | |
| Independent | Sam Navabi | 168 | 0.5 | N/A | |
| Fight for an Anti-War Government | Roger Nettleship | 91 | 0.2 | N/A | |
| Majority | 11,109 | 30.4 | -10.4 | ||
| Turnout | 36,518 | 57.7 | +7.0 | ||
| Labour hold | Swing | -6.4 | |||
Elections in the 2000s
| Party | Candidate | Votes | % | ± | |
|---|---|---|---|---|---|
| Labour | David Miliband | 18,269 | 60.5 | −2.7 | |
| Liberal Democrat | Stephen Psallidas | 5,957 | 19.7 | +2.9 | |
| Conservative | Richard Lewis | 5,207 | 17.2 | +0.3 | |
| Independent | Nader Afshari-Naderi | 773 | 2.6 | N/A | |
| Majority | 12,312 | 40.8 | −5.5 | ||
| Turnout | 30,206 | 42.2 | −7.5 | ||
| Labour hold | Swing | −2.8 | |||
| Party | Candidate | Votes | % | ± | |
|---|---|---|---|---|---|
| Labour | David Miliband | 19,230 | 63.2 | −8.3 | |
| Conservative | Joanna Gardner | 5,140 | 16.9 | +2.3 | |
| Liberal Democrat | Marshall Grainger | 5,127 | 16.8 | +8.0 | |
| UKIP | Alan Hardy | 689 | 2.3 | N/A | |
| Independent | Roger Nettleship | 262 | 0.9 | N/A | |
| Majority | 14,090 | 46.3 | −10.5 | ||
| Turnout | 30,448 | 49.7 | −12.9 | ||
| Labour hold | Swing | −5.3 | |||
Elections in the 1990s
| Party | Candidate | Votes | % | ± | |
|---|---|---|---|---|---|
| Labour | David George Clark | 27,834 | 71.4 | +11.6 | |
| Conservative | Mark Hoban | 5,681 | 14.6 | −12.8 | |
| Liberal Democrat | David Ord | 3,429 | 8.8 | −4.0 | |
| Referendum | Alan Lorriane | 1,660 | 4.3 | N/A | |
| Independent | Ian Wilburn | 374 | 1.0 | N/A | |
| Majority | 22,153 | 56.8 | +24.5 | ||
| Turnout | 38,978 | 62.5 | −4.8 | ||
| Labour hold | Swing | +12.2 | |||
| Party | Candidate | Votes | % | ± | |
|---|---|---|---|---|---|
| Labour | David George Clark | 24,876 | 59.8 | +1.9 | |
| Conservative | Jonathan L Howard | 11,399 | 27.4 | +1.7 | |
| Liberal Democrat | Arthur Preece | 5,344 | 12.8 | N/A | |
| Majority | 13,477 | 32.4 | +0.15 | ||
| Turnout | 41,619 | 70.1 | −0.7 | ||
| Labour hold | Swing | +0.1 | |||
Elections in the 1980s
| Party | Candidate | Votes | % | ± | |
|---|---|---|---|---|---|
| Labour | David George Clark | 24,882 | 57.9 | +11.2 | |
| Conservative | Michael Fabricant | 11,031 | 25.7 | −5.2 | |
| Social Democratic | Margaret Mary Melling | 6,654 | 15.5 | −7.2 | |
| Democrat | Edward Grieves Dunn | 408 | 1.0 | N/A | |
| Majority | 13,851 | 32.2 | +16.6 | ||
| Turnout | 42,975 | 70.7 | +4.5 | ||
| Labour hold | Swing | +8.2 | |||
| Party | Candidate | Votes | % | ± | |
|---|---|---|---|---|---|
| Labour | David George Clark | 19,055 | 46.5 | -10.6 | |
| Conservative | PJ Groves | 15,551 | 30.1 | -0.1 | |
| Social Democratic | PJ Angus | 9,288 | 22.7 | +10.7 | |
| Majority | 6,402 | 15.6 | -10.5 | ||
| Turnout | 40,996 | 66.2 | -5.0 | ||
| Labour hold | Swing | -52.5 | |||
Elections in the 1970s
| Party | Candidate | Votes | % | ± | |
|---|---|---|---|---|---|
| Labour | David George Clark | 28,675 | 57.0 | +0.7 | |
| Conservative | R Booth | 15,551 | 31.0 | +6.1 | |
| Liberal | L Monger | 6,003 | 12.0 | -5.3 | |
| Majority | 13,124 | 26.1 | -5.4 | ||
| Turnout | 50,229 | 71.2 | +6.5 | ||
| Labour hold | Swing | -2.7 | |||
| Party | Candidate | Votes | % | ± | |
|---|---|---|---|---|---|
| Labour | Arthur Blenkinsop | 26,492 | 56.4 | -3.4 | |
| Conservative | NS Smith | 11,667 | 24.8 | -11.6 | |
| Liberal | L Garbutt | 8,106 | 17.3 | N/A | |
| National Front | W Owen | 711 | 1.5 | -2.5 | |
| Majority | 14,825 | 31.6 | +8.2 | ||
| Turnout | 46,976 | 64.7 | -6.9 | ||
| Labour hold | Swing | +4.1 | |||
| Party | Candidate | Votes | % | ± | |
|---|---|---|---|---|---|
| Labour | Arthur Blenkinsop | 30,740 | 58.8 | +0.4 | |
| Conservative | S Smith | 18,754 | 36.4 | -3.4 | |
| National Front | W Owen | 1,958 | 3.8 | N/A | |
| Majority | 11,986 | 23.3 | +3.0 | ||
| Turnout | 51,452 | 71.6 | +4.8 | ||
| Labour hold | Swing | +1.9 | |||
| Party | Candidate | Votes | % | ± | |
|---|---|---|---|---|---|
| Labour | Arthur Blenkinsop | 30,191 | 60.2 | -4.5 | |
| Conservative | John McKee | 19,960 | 39.8 | +4.5 | |
| Majority | 10,231 | 20.4 | -9.0 | ||
| Turnout | 50,151 | 66.8 | -1.7 | ||
| Labour hold | Swing | -4.5 | |||
Elections in the 1960s
| Party | Candidate | Votes | % | ± | |
|---|---|---|---|---|---|
| Labour | Arthur Blenkinsop | 31,829 | 64.7 | +9.6 | |
| Conservative | Charles MacKenzie Dallas | 17,340 | 35.3 | +4.9 | |
| Majority | 14,489 | 29.5 | +4.7 | ||
| Turnout | 49,169 | 68.7 | -5.4 | ||
| Labour hold | Swing | +2.35 | |||
| Party | Candidate | Votes | % | ± | |
|---|---|---|---|---|---|
| Labour | Arthur Blenkinsop | 29,694 | 55.1 | -2.8 | |
| Conservative | John Chalmers | 16,344 | 30.3 | -11.7 | |
| Liberal | Thomas Henry Campbell Wardlaw | 7,837 | 14.6 | N/A | |
| Majority | 13,350 | 24.8 | +8.9 | ||
| Turnout | 53,875 | 74.1 | -0.3 | ||
| Labour hold | Swing | +4.45 | |||
Elections in the 1950s
| Party | Candidate | Votes | % | ± | |
|---|---|---|---|---|---|
| Labour | James Chuter Ede | 32,577 | 58.0 | -1.7 | |
| Conservative | John Chalmers | 23,638 | 42.0 | +1.7 | |
| Majority | 8,939 | 15.9 | -3.4 | ||
| Turnout | 56,215 | 74.4 | +2.8 | ||
| Labour hold | Swing | -1.7 | |||
| Party | Candidate | Votes | % | ± | |
|---|---|---|---|---|---|
| Labour | James Chuter Ede | 31,734 | 59.6 | +3.7 | |
| Conservative | John Chalmers | 21,482 | 40.4 | +6.9 | |
| Majority | 10,252 | 19.3 | -3.0 | ||
| Turnout | 53,216 | 74.4 | -9.3 | ||
| Labour hold | Swing | -1.6 | |||
| Party | Candidate | Votes | % | ± | |
|---|---|---|---|---|---|
| Labour | James Chuter Ede | 33,633 | 56.0 | +0.6 | |
| Conservative | John Chalmers | 20,208 | 33.6 | +6.8 | |
| Liberal | Charles Jonathan Kitchell | 6,270 | 10.4 | -5.5 | |
| Majority | 13,425 | 22.3 | -7.3 | ||
| Turnout | 74,657 | 80.5 | -1.2 | ||
| Labour hold | Swing | -3.7 | |||
| Party | Candidate | Votes | % | ± | |
|---|---|---|---|---|---|
| Labour | James Chuter Ede | 33,452 | 56.5 | -2.9 | |
| Conservative | John Chalmers | 15,897 | 28.9 | N/A | |
| Liberal | John George | 9,446 | 16.0 | N/A | |
| Communist | FO Smith | 415 | 0.7 | N/A | |
| Majority | 17,555 | 29.7 | +10.8 | ||
| Turnout | 59,210 | 81.7 | +8.6 | ||
| Labour hold | Swing | +5.4 | |||
Elections in the 1940s
| Party | Candidate | Votes | % | ± | |
|---|---|---|---|---|---|
| Labour | James Chuter Ede | 22,410 | 59.4 | +11.3 | |
| Liberal National | Donald Maurice Parry | 15,296 | 40.6 | N/A | |
| Majority | 7,114 | 18.9 | +12.6 | ||
| Turnout | 37,706 | 73.1 | -0.3 | ||
| Labour hold | Swing | +12.6 | |||
Elections in the 1930s
| Party | Candidate | Votes | % | ± | |
|---|---|---|---|---|---|
| Labour | James Chuter Ede | 22,031 | 48.16 | ||
| Liberal | Harcourt Johnstone | 12,932 | 29.27 | ||
| National Labour | Frederick Burden | 10,784 | 23.57 | ||
| Majority | 9,099 | 19.89 | |||
| Turnout | 72.79 | ||||
| Labour gain from Liberal | Swing | ||||
| Party | Candidate | Votes | % | ± | |
|---|---|---|---|---|---|
| Liberal | Harcourt Johnstone | 30,528 | 59.81 | ||
| Labour | James Chuter Ede | 20,512 | 40.19 | ||
| Majority | 10,016 | 19.62 | |||
| Turnout | 80.13 | ||||
| Liberal gain from Labour | Swing | ||||
Elections in the 1920s
| Party | Candidate | Votes | % | ± | |
|---|---|---|---|---|---|
| Labour | James Chuter Ede | 18,938 | 42.2 | +0.1 | |
| Liberal | Hon. Harold Burge Robson | 18,898 | 42.0 | -15.9 | |
| Unionist | William Nunn | 7,110 | 15.8 | n/a | |
| Majority | 40 | 0.2 | 16.0 | ||
| Turnout | 72.9 | -2.4 | |||
| Labour gain from Liberal | Swing | +8.0 | |||
| Party | Candidate | Votes | % | ± | |
|---|---|---|---|---|---|
| Liberal | Edward Augustine St Aubyn Harney | 23,171 | 57.9 | -1.4 | |
| Labour | William Lawther | 16,852 | 42.1 | +1.4 | |
| Majority | 6,319 | 15.8 | -2.8 | ||
| Turnout | 75.3 | +1.8 | |||
| Liberal hold | Swing | -1.4 | |||
| Party | Candidate | Votes | % | ± | |
|---|---|---|---|---|---|
| Liberal | Edward Augustine St Aubyn Harney | 22,912 | 59.3 | +19.5 | |
| Labour | William Lawther | 15,717 | 40.7 | +1.0 | |
| Majority | 7,195 | 18.6 | +18.5 | ||
| Turnout | 73.5 | -2.7 | |||
| Liberal hold | Swing | +9.5 | |||
| Party | Candidate | Votes | % | ± | |
|---|---|---|---|---|---|
| Liberal | Edward Augustine St Aubyn Harney | 15,760 | 39.8 | n/a | |
| Labour | William Lawther | 15,735 | 39.7 | +14.9 | |
| National Liberal | Joseph Havelock Wilson | 8,121 | 20.5 | -54.7 | |
| Majority | 25 | 0.1 | 50.5 | ||
| Turnout | 76.2 | +24.9 | |||
| Liberal hold | Swing | n/a | |||
Elections in the 1910s
| Party | Candidate | Votes | % | ± | |
|---|---|---|---|---|---|
| Liberal | 19,514 | 75.2 | N/A | ||
| Labour | George John Rowe | 6,425 | 24.8 | N/A | |
| Majority | 13,089 | 50.4 | N/A | ||
| Turnout | 51.3 | N/A | |||
| Liberal hold | Swing | N/A | |||
- endorsed by Coalition government
| Party | Candidate | Votes | % | ± | |
|---|---|---|---|---|---|
| Liberal | Joseph Havelock Wilson | Unopposed | N/A | N/A | |
| Liberal hold | Swing | N/A | |||
| Party | Candidate | Votes | % | ± | |
|---|---|---|---|---|---|
| Liberal | Cecil Cochrane | Unopposed | N/A | N/A | |
| Liberal hold | Swing | N/A | |||
| Party | Candidate | Votes | % | ± | |
|---|---|---|---|---|---|
| Liberal | Rt Hon. Russell Rea | unopposed | n/a | n/a | |
| Liberal hold | Swing | n/a | |||
| Party | Candidate | Votes | % | ± | |
|---|---|---|---|---|---|
| Liberal | Rt Hon. Russell Rea | Unopposed | N/A | N/A | |
| Liberal hold | Swing | N/A | |||
| Party | Candidate | Votes | % | ± | |
|---|---|---|---|---|---|
| Liberal | Rt Hon. Sir William Snowdon Robson | 9,090 | 65.2 | -8.7 | |
| Liberal Unionist | Roland Edmund Lomax Vaughan Williams | 4,854 | 34.8 | +8.7 | |
| Majority | -17.4 | ||||
| Turnout | 76.1 | +3.5 | |||
| Liberal hold | Swing | -8.7 | |||
Elections in the 1900s
| Party | Candidate | Votes | % | ± | |
|---|---|---|---|---|---|
| Liberal | Rt Hon. Sir William Snowdon Robson | 9,717 | 73.9 | ||
| Liberal Unionist | A R Chamberlayne | 3,431 | 26.1 | ||
| Majority | 6,286 | 47.8 | +19.2 | ||
| Turnout | 72.6 | ||||
| Liberal hold | Swing | ||||
| Party | Candidate | Votes | % | ± | |
|---|---|---|---|---|---|
| Liberal | William Snowdon Robson | 7,417 | 64.3 | ||
| Conservative | R Readhead | 4,119 | 35.7 | ||
| Majority | 3,298 | 28.6 | |||
| Turnout | 72.0 | ||||
| Liberal hold | Swing | ||||
See also
References
- ↑ "Parliament Constituency population 2011". Retrieved 6 July 2015.
- ↑ "David Miliband to step down as MP". BBC News. 26 March 2013. Retrieved 26 March 2013.
- ↑ Leigh Rayment's Historical List of MPs – Constituencies beginning with "S" (part 4)
- ↑ http://davidmiliband.net/south-shields/
- ↑ "Election Data 2015". Electoral Calculus. Archived from the original on 17 October 2015. Retrieved 17 October 2015.
- ↑ "South Shields Parliamentary constituency". Election 2015. BBC News. Retrieved 31 March 2016.
- ↑ South Shields by-election", South Tyneside Council
- ↑ "South Shields Constituency - 02 May 2013 Parliamentary By-Election". SouthTyneside.info. Retrieved 3 May 2013.
- ↑ "South Shields by-election: Labour wins as UKIP makes big gains". BBC News. 3 May 2013. Retrieved 3 May 2013.
- ↑ "Election Data 2010". Electoral Calculus. Archived from the original on 17 October 2015. Retrieved 17 October 2015.
- ↑ "UK General Election results May 2010, part21". Richard Kimber's political science resources. Retrieved 3 May 2013.
- ↑ "Election Data 2005". Electoral Calculus. Archived from the original on 15 October 2011. Retrieved 18 October 2015.
- ↑ "UK General Election results May 2005, part18". Richard Kimber's political science resources. Retrieved 3 May 2013.
- ↑ "Election Data 2001". Electoral Calculus. Archived from the original on 15 October 2011. Retrieved 18 October 2015.
- 1 2 "UK General Election results: South Shields, 1997 and 2001". Richard Kimber's political science resources. Retrieved 3 May 2013.
- ↑ "Election Data 1997". Electoral Calculus. Archived from the original on 15 October 2011. Retrieved 18 October 2015.
- ↑ "Election Data 1992". Electoral Calculus. Archived from the original on 15 October 2011. Retrieved 18 October 2015.
- ↑ "UK General Election results, April 1992, part 18". Richard Kimber's political science resources. Retrieved 3 May 2013.
- ↑ "Election Data 1987". Electoral Calculus. Archived from the original on 15 October 2011. Retrieved 18 October 2015.
- ↑ "UK General Election results, June 1983 (part 18)". Richard Kimber's political science resources. Retrieved 3 May 2013.
- ↑ "Election Data 1983". Electoral Calculus. Archived from the original on 15 October 2011. Retrieved 18 October 2015.
- ↑ "UK General Election results. June 1983, part 18". Richard Kimber's political science resources. Retrieved 3 May 2013.
- ↑ "UK General Election results, May 1979, part 18". Richard Kimber's political science resources. Retrieved 3 May 2013.
- ↑ "UK General Election results, October 1974 (part 18)". Richard Kimber's political science resources. Retrieved 3 May 2013.
- ↑ "UK General Election results, February 1974 (part 18)". Richard Kimber's political science resources. Retrieved 3 May 2013.
- ↑ "UK General Election results, June 1970 (part 18)". Richard Kimber's political science resources. Retrieved 3 May 2013.
- ↑ "UK General Election results, March 1966 (part 18)". Richard Kimber's political science resources. Retrieved 3 May 2013.
- ↑ "UK General Election results, October 1964 (part 18)". Richard Kimber's political science resources. Retrieved 3 May 2013.
- 1 2 "UK General Election results, October 1959 (part 18)". Richard Kimber's political science resources. Retrieved 4 May 2013.
- ↑ "UK General Election results, May 1955 (part 18)". Richard Kimber's political science resources. Retrieved 4 May 2013.
- ↑ "UK General Election results, October 1951 (part 18)". Richard Kimber's political science resources. Retrieved 4 May 2013.
- ↑ "UK General Election results, July 1945 (part 18)". Richard Kimber's political science resources. Retrieved 4 May 2013.
- 1 2 3 4 5 British parliamentary election results, 1918-1949, Fred W. S. Craig
- 1 2 3 4 5 British parliamentary election results, 1885-1918 (Craig)
Craig, F. W. S. (1983). British parliamentary election results 1918-1949 (3 ed.). Chichester: Parliamentary Research Services. ISBN 0-900178-06-X.