Blaydon (UK Parliament constituency)
Coordinates: 54°57′N 1°43′W / 54.950°N 1.717°W
| Blaydon | |
|---|---|
|
Borough constituency for the House of Commons | |
|
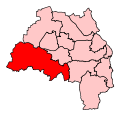
Boundary of Blaydon in Tyne and Wear. | |
|
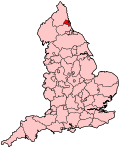
Location of Tyne and Wear within England. | |
| County | Tyne and Wear |
| Population | 88,281 (2011 census)[1] |
| Electorate | 68,156 (December 2010)[2] |
| Major settlements | Birtley, Blaydon, Rowlands Gill, Ryton and Whickham |
| Current constituency | |
| Created | 1918 |
| Member of parliament | David Anderson (Labour) |
| Number of members | One |
| Overlaps | |
| European Parliament constituency | North East England |
Blaydon is a constituency[n 1] represented in the House of Commons of the UK Parliament since 2005 by David Anderson of the Labour Party.[n 2]
Constituency profile
The seat has been a safe seat for the Labour Party since 1945.
Historically the area's economy relied on coal mining from the Victorian period until the decline of mining in the latter half of the 20th century.
Today the economy is supported by engineering and service industries on Tyneside, and agriculture.
The constituency is on the western upland outskirts of Gateshead and its communities are separated by green buffers.
Boundaries
1918-1950: The Urban Districts of Blaydon, Ryton, Tanfield, and Whickham.
1950-1983: The Urban Districts of Blaydon, Ryton, and Whickham.
1983-2010: The Metropolitan Borough of Gateshead wards of Birtley, Blaydon, Chopwell and Rowlands Gill, Crawcrook and Greenside, Lamesley, Ryton, Whickham North, Whickham South, and Winlaton.
2010-present: The Metropolitan Borough of Gateshead wards of Birtley, Blaydon, Chopwell and Rowlands Gill, Crawcrook and Greenside, Dunston Hill and Whickham East, Lamesley, Ryton, Crookhill and Stella, Whickham North, Whickham South and Sunniside, and Winlaton and High Spen.
The Blaydon constituency comprises the towns of Blaydon, Whickham, Ryton, Birtley and surrounding villages in the south and west of the Metropolitan Borough of Gateshead.
Members of Parliament
Elections
Elections in the 2010s
| Party | Candidate | Votes | % | ± | |
|---|---|---|---|---|---|
| Labour | Dave Anderson | 22,090 | 49.2 | -0.5 | |
| UKIP | Mark Bell | 7,863 | 17.5 | +17.5 | |
| Conservative | Alison Griffiths | 7,838 | 17.4 | +1.5 | |
| Liberal Democrat | Jonathan Wallace | 5,497 | 12.2 | -17.1 | |
| Green | Paul McNally[5] | 1,648 | 3.7 | +3.7 | |
| Majority | 14,227 | 31.7 | +11.4 | ||
| Turnout | 44,936 | 66.4 | +0.2 | ||
| Labour hold | Swing | -9.0 | |||
| Party | Candidate | Votes | % | ± | |
|---|---|---|---|---|---|
| Labour | Dave Anderson | 22,297 | 49.6 | −1.9 | |
| Liberal Democrat | Neil Bradbury | 13,180 | 29.3 | −8.5 | |
| Conservative | Glenn Hall | 7,159 | 15.9 | +7.9 | |
| BNP | Keith McFarlane | 2,277 | 5.1 | +5.1 | |
| Majority | 9,117 | 20.3 | |||
| Turnout | 44,913 | 66.2 | +4.0 | ||
| Labour hold | Swing | −4.5 | |||
Elections in the 2000s
| Party | Candidate | Votes | % | ± | |
|---|---|---|---|---|---|
| Labour | David Anderson | 20,120 | 51.5 | −3.3 | |
| Liberal Democrat | Peter J. Maughan | 14,785 | 37.9 | +4.1 | |
| Conservative | Mrs. Dorothy Luckhurst | 3,129 | 8.0 | −3.4 | |
| UKIP | Norman R. Endacott | 1,019 | 2.6 | +2.6 | |
| Majority | 5,335 | 13.7 | |||
| Turnout | 39,053 | 62.6 | +5.2 | ||
| Labour hold | Swing | −3.7 | |||
| Party | Candidate | Votes | % | ± | |
|---|---|---|---|---|---|
| Labour | John McWilliam | 20,340 | 54.8 | −5.1 | |
| Liberal Democrat | Peter J. Maughan | 12,531 | 33.8 | +10.0 | |
| Conservative | Mark A. Watson | 4,215 | 11.4 | −1.8 | |
| Majority | 7,809 | 21.0 | |||
| Turnout | 37,086 | 57.4 | −13.6 | ||
| Labour hold | Swing | ||||
Elections in the 1990s
| Party | Candidate | Votes | % | ± | |
|---|---|---|---|---|---|
| Labour | John David McWilliam | 27,535 | 60.0 | ||
| Liberal Democrat | Peter J. Maughan | 10,930 | 23.8 | ||
| Conservative | Mark A. Watson | 6,048 | 13.2 | ||
| Independent | Richard J. Rook | 1,412 | 3.1 | ||
| Majority | 16,605 | 36.1 | |||
| Turnout | 45,925 | 71.0 | |||
| Labour hold | Swing | ||||
| Party | Candidate | Votes | % | ± | |
|---|---|---|---|---|---|
| Labour | John McWilliam | 27,028 | 52.7 | +2.3 | |
| Conservative | Peter Richard Pescod | 13,685 | 26.7 | +2.5 | |
| Liberal Democrat | Paul Nunn | 10,602 | 20.7 | −4.8 | |
| Majority | 13,343 | 26.0 | +1.1 | ||
| Turnout | 51,315 | 77.7 | +2.0 | ||
| Labour hold | Swing | −0.1 | |||
Elections in the 1980s
| Party | Candidate | Votes | % | ± | |
|---|---|---|---|---|---|
| Labour | John David McWilliam | 25,277 | 50.34 | ||
| Social Democratic | Paul Nunn | 12,789 | 25.47 | ||
| Conservative | Peter Richard Pescod | 12,147 | 24.19 | ||
| Majority | 12,488 | 24.87 | |||
| Turnout | 75.73 | ||||
| Labour hold | Swing | ||||
| Party | Candidate | Votes | % | ± | |
|---|---|---|---|---|---|
| Labour | John McWilliam | 21,285 | 44.39 | ||
| Conservative | A. Williams | 14,063 | 29.33 | ||
| Social Democratic | M. Carr | 12,607 | 26.29 | ||
| Majority | 7,222 | 15.06 | |||
| Turnout | 73.23 | ||||
| Labour hold | Swing | ||||
Elections in the 1970s
| Party | Candidate | Votes | % | ± | |
|---|---|---|---|---|---|
| Labour | John McWilliam | 24,687 | 53.40 | ||
| Conservative | T. Middleton | 16,178 | 35.00 | ||
| Liberal | D. Hutton | 5,364 | 11.60 | ||
| Majority | 8,509 | 18.41 | |||
| Turnout | 79.07 | ||||
| Labour hold | Swing | ||||
| Party | Candidate | Votes | % | ± | |
|---|---|---|---|---|---|
| Labour | Robert Edward Woof | 23,743 | 57.27 | ||
| Conservative | A.A. Craig | 10,277 | 24.79 | ||
| Liberal | P. Barker | 7,439 | 17.94 | ||
| Majority | 13,466 | 32.48 | |||
| Turnout | 69.20 | ||||
| Labour hold | Swing | ||||
| Party | Candidate | Votes | % | ± | |
|---|---|---|---|---|---|
| Labour | Robert Edward Woof | 22,279 | 58.65 | ||
| Conservative | A.A. Craig | 15,705 | 41.35 | ||
| Majority | 6,574 | 17.31 | |||
| Turnout | 67.25 | ||||
| Labour hold | Swing | ||||
| Party | Candidate | Votes | % | ± | |
|---|---|---|---|---|---|
| Labour | Robert Edward Woof | 25,724 | 64.88 | ||
| Conservative | Norman H. D'Aguiar | 13,926 | 35.12 | ||
| Majority | 11,798 | 29.76 | |||
| Turnout | 72.30 | ||||
| Labour hold | Swing | ||||
Elections in the 1960s
| Party | Candidate | Votes | % | ± | |
|---|---|---|---|---|---|
| Labour | Robert Edward Woof | 26,629 | 69.21 | ||
| Conservative | Bernard Bligh | 11,849 | 30.79 | ||
| Majority | 14,780 | 38.41 | |||
| Turnout | 77.45 | ||||
| Labour hold | Swing | ||||
| Party | Candidate | Votes | % | ± | |
|---|---|---|---|---|---|
| Labour | Robert Edward Woof | 25,926 | 66.72 | ||
| Conservative | Neville Cooper Bailey | 12,932 | 33.28 | ||
| Majority | 12,994 | 33.44 | |||
| Turnout | 80.01 | ||||
| Labour hold | Swing | ||||
Elections in the 1950s
| Party | Candidate | Votes | % | ± | |
|---|---|---|---|---|---|
| Labour | Robert Edward Woof | 25,969 | 65.43 | ||
| Conservative | Godfrey William Iredell | 13,719 | 34.57 | ||
| Majority | 12,250 | 30.87 | |||
| Turnout | 82.94 | ||||
| Labour hold | Swing | ||||
| Party | Candidate | Votes | % | ± | |
|---|---|---|---|---|---|
| Labour | Robert Edward Woof | 18,791 | 69.9 | +3.4 | |
| Conservative | John Morley Reay-Smith | 8,077 | 30.1 | -3.4 | |
| Majority | 10,714 | 39.8 | |||
| Turnout | 26,868 | ||||
| Labour hold | Swing | -3.4 | |||
| Party | Candidate | Votes | % | ± | |
|---|---|---|---|---|---|
| Labour | William Whiteley | 25,273 | 66.47 | ||
| Conservative | John Morley Reay-Smith | 12,750 | 33.53 | ||
| Majority | 12,523 | 32.94 | |||
| Turnout | 80.66 | ||||
| Labour hold | Swing | ||||
| Party | Candidate | Votes | % | ± | |
|---|---|---|---|---|---|
| Labour | William Whiteley | 28,337 | 68.18 | ||
| Conservative | Charles Percy Lawler Satchwell | 13,223 | 31.82 | ||
| Majority | 15,114 | 36.37 | |||
| Turnout | 87.60 | ||||
| Labour hold | Swing | ||||
| Party | Candidate | Votes | % | ± | |
|---|---|---|---|---|---|
| Labour | William Whiteley | 28,343 | 68.94 | ||
| Conservative | Leslie Frances Lawson | 12,772 | 31.06 | ||
| Majority | 15,571 | 37.87 | |||
| Turnout | 87.46 | ||||
| Labour hold | Swing | ||||
Election in the 1940s
| Party | Candidate | Votes | % | ± | |
|---|---|---|---|---|---|
| Labour | William Whiteley | 29,931 | 71.65 | ||
| Conservative | Edward Charles Peake | 11,842 | 28.35 | ||
| Majority | 18,089 | 43.30 | |||
| Turnout | 79.70 | ||||
| Labour hold | Swing | ||||
Elections in the 1930s
| Party | Candidate | Votes | % | ± | |
|---|---|---|---|---|---|
| Labour | William Whiteley | 24,148 | 62.29 | ||
| Conservative | Charles Edwin Vickery | 14,622 | 37.71 | ||
| Majority | 9,526 | 24.57 | |||
| Turnout | 80.76 | ||||
| Labour gain from Conservative | Swing | ||||
| Party | Candidate | Votes | % | ± | |
|---|---|---|---|---|---|
| Conservative | Thomas Ballantyne Martin | 18,927 | 50.66 | ||
| Labour | William Whiteley | 18,431 | 49.34 | ||
| Majority | 496 | 1.33 | |||
| Turnout | 80.95 | ||||
| Conservative gain from Labour | Swing | ||||
Elections in the 1920s
| Party | Candidate | Votes | % | ± | |
|---|---|---|---|---|---|
| Labour | William Whiteley | 21,221 | 59.1 | -3.5 | |
| Unionist | R. Charles White | 7,847 | 21.8 | -15.6 | |
| Liberal | Thomas Magnay | 6878 | 19.1 | n/a | |
| Majority | 13,374 | 37.3 | +12.1 | ||
| Turnout | 79.5 | +2.5 | |||
| Labour hold | Swing | +6.0 | |||
| Party | Candidate | Votes | % | ± | |
|---|---|---|---|---|---|
| Labour | William Whiteley | 17,670 | |||
| Unionist | George Denson | 10,549 | |||
| Majority | |||||
| Turnout | |||||
| Labour hold | Swing | ||||
| Party | Candidate | Votes | % | ± | |
|---|---|---|---|---|---|
| Labour | William Whiteley | 15,073 | 67.9 | +14.0 | |
| Unionist | George Denson | 7,124 | 32.1 | +2.9 | |
| Majority | 7,949 | 35.8 | +11.1 | ||
| Turnout | 62.1 | -14.9 | |||
| Labour hold | Swing | +5.5 | |||
| Party | Candidate | Votes | % | ± | |
|---|---|---|---|---|---|
| Labour | William Whiteley | 14,722 | |||
| Unionist | Frank Robert Simpson | 7,963 | n/a | ||
| National Liberal | Frederick William Cook | 4,606 | |||
| Majority | |||||
| Turnout | |||||
| Labour gain from Labour | Swing | ||||
| Party | Candidate | Votes | % | ± | |
|---|---|---|---|---|---|
| Coalition Liberal | Walter Waring | 9,937 | n/a | ||
| Labour | William Whiteley | 7,844 | n/a | ||
| Liberal | Thomas George Graham | 1,064 | n/a | ||
| Majority | n/a | ||||
| Turnout | n/a | ||||
| Coalition Liberal win | |||||
See also
Notes and references
- Notes
- ↑ A borough constituency (for the purposes of election expenses and type of returning officer)
- ↑ As with all constituencies, the constituency elects one Member of Parliament (MP) by the first past the post system of election at least every five years.
- References
- ↑ "Blaydon: Usual Resident Population, 2011". Neighbourhood Statistics. Office for National Statistics. Retrieved 31 January 2015.
- ↑ "Electorate Figures - Boundary Commission for England". 2011 Electorate Figures. Boundary Commission for England. 4 March 2011. Archived from the original on 6 November 2010. Retrieved 13 March 2011.
- ↑ Leigh Rayment's Historical List of MPs – Constituencies beginning with "B" (part 3)
- ↑ "Election Data 2015". Electoral Calculus. Archived from the original on 17 October 2015. Retrieved 17 October 2015.
- ↑ http://www.thenorthernecho.co.uk/news/11728362.Greens_name_election_candidates/
- ↑ "Election Data 2010". Electoral Calculus. Archived from the original on 17 October 2015. Retrieved 17 October 2015.
- ↑ http://www.gateshead.gov.uk/DocumentLibrary/council/ElectoralServices/Blaydon-StatementofPersonsNominatedNoticeofPoll.pdf
- ↑ "Election Data 2005". Electoral Calculus. Archived from the original on 15 October 2011. Retrieved 18 October 2015.
- ↑ "Election Data 2001". Electoral Calculus. Archived from the original on 15 October 2011. Retrieved 18 October 2015.
- ↑ "Election Data 1997". Electoral Calculus. Archived from the original on 15 October 2011. Retrieved 18 October 2015.
- ↑ "Election Data 1992". Electoral Calculus. Archived from the original on 15 October 2011. Retrieved 18 October 2015.
- ↑ "Politics Resources". Election 1992. Politics Resources. 9 April 1992. Retrieved 2010-12-06.
- ↑ "Election Data 1987". Electoral Calculus. Archived from the original on 15 October 2011. Retrieved 18 October 2015.
- ↑ "Election Data 1983". Electoral Calculus. Archived from the original on 15 October 2011. Retrieved 18 October 2015.
- ↑ British Parliamentary Election Results 1918-49, FWS Craig