Dutch general election, 1994
Dutch general election, 1994
 |
| 3 May 1994 |
| Turnout |
78.8% |
|
|
| This lists parties that won seats. See the complete results below. |
| |
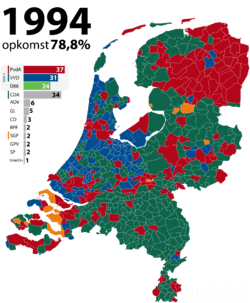
Strongest political party by municipality
General elections were held in the Netherlands on 3 May 1994.[1] The Labour Party emerged as the largest party, winning 37 of the 150 seats in the House of Representatives.[2] The election resulted in significant losses for both the Labour Party and the Christian Democratic Appeal. The two liberal parties, People's Party for Freedom and Democracy and Democrats 66 made large gains, whilst two pro-elderly parties and the Socialist Party all passed the electoral threshold to win seats.
The formation of a government coalition was arduous but after four months the First Kok cabinet was formed. It was an unprecedented coalition of the two liberal parties and Labour. The CDA was consigned to opposition for the first time in its history. It was also the first government since 1918 not to include a Christian Democratic party.
Results
| Party |
Votes |
% |
Seats |
+/– |
|---|
| Labour Party | 2,153,135 | 24.0 | 37 | –12 |
| Christian Democratic Appeal | 1,996,418 | 22.2 | 34 | –20 |
| People's Party for Freedom and Democracy | 1,792,401 | 20.0 | 31 | +9 |
| Democrats 66 | 1,391,202 | 15.5 | 24 | +12 |
| General Elderly Alliance | 326,401 | 3.6 | 6 | New |
| GreenLeft | 311,399 | 3.5 | 5 | –1 |
| Centre Democrats | 220,734 | 2.5 | 3 | +2 |
| Reformatory Political Federation | 158,705 | 1.8 | 3 | +2 |
| Reformed Political Party | 155,251 | 1.7 | 2 | –1 |
| Reformed Political League | 119,158 | 1.3 | 2 | 0 |
| Socialist Party | 118,768 | 1.3 | 2 | +2 |
| Union 55+ | 78,147 | 0.9 | 1 | New |
| Centre Party '86 | 32,327 | 0.4 | 0 | New |
| Natural Law Party | 27,665 | 0.3 | 0 | New |
| Progressive Integration Party | 17,230 | 0.2 | 0 | New |
| The Greens | 13,902 | 0.2 | 0 | 0 |
| New Communist Party of the Netherlands | 11,630 | 0.1 | 0 | New |
| Solidarity Farmers' Party | 9,096 | 0.1 | 0 | New |
| Party for Environment and Justice | 8,716 | 0.1 | 0 | New |
| Solidarity '93 | 7,919 | 0.1 | 0 | New |
| Pacifist Socialist Party '92 | 7,385 | 0.1 | 0 | New |
| The New Party | 6,825 | 0.1 | 0 | New |
| General Democratic Party | 5,196 | 0.1 | 0 | New |
| Patriotic Democratic Appeal | 4,845 | 0.1 | 0 | New |
| Socialist Alternative Politics | 4,347 | 0.1 | 0 | 0 |
| Libertarian Party | 2,754 | 0.0 | 0 | New |
| Invalid/blank votes | 46,331 | – | – | – |
| Total | 9,027,887 | 100 | 150 | 0 |
| Registered voters/turnout | 11,455,924 | 78.8 | – | – |
| Source: Nohlen & Stöver, European Elections Database |
| Popular Vote |
|---|
|
|
|
|
|
| PvdA |
|
23.97% |
| CDA |
|
22.23% |
| VVD |
|
19.96% |
| D66 |
|
15.49% |
| AOV |
|
3.63% |
| GL |
|
3.47% |
| CD |
|
2.46% |
| RPF |
|
1.77% |
| SGP |
|
1.73% |
| GPV |
|
1.33% |
| SP |
|
1.32% |
| Unie 55+ |
|
0.87% |
| Other |
|
1.78% |
References
- ↑ Nohlen, D & Stöver, P (2010) Elections in Europe: A data handbook, p1396 ISBN 978-3-8329-5609-7
- ↑ Nohlen & Stöver, p1414
Further reading
- Irwin, Galen A. "The Dutch Parliamentary Election of 1994," Electoral Studies (1995) 14#1 pp. 72-77