Elections in the Netherlands
![Azure, billetty Or a lion with a coronet Or armed and langued Gules holding in his dexter paw a sword Argent hilted Or and in the sinister paw seven arrows Argent pointed and bound together Or. [The seven arrows stand for the seven provinces of the Union of Utrecht.] The shield is crowned with the (Dutch) royal crown and supported by two lions Or armed and langued gules. They stand on a scroll Azure with the text (Or) "Je Maintiendrai" (French for "I will maintain".)](../I/m/State_coat_of_arms_of_the_Netherlands.svg.png) |
| This article is part of a series on the politics and government of the Netherlands |
|
|
Local government |
|
Elections in the Netherlands are held for six territorial levels of government: the European Union, the state, the twelve Provinces of the Netherlands, the 25 water boards, the 403 municipalities (and the 3 public bodies in the Caribbean Netherlands) and in two cities (Amsterdam and Rotterdam) for neighbourhood councils (stadsdeelraden). Apart from elections, referenda are also held occasionally, a fairly recent phenomenon in Dutch politics. The most recent national election results and an overview of the resulting seat assignments and coalitions since World War II are shown at the bottom of this page.
At the national level, legislative power is invested in the States General (Staten-Generaal), which is bicameral. The House of Representatives (Tweede Kamer) has 150 members, elected for a four-year term by proportional representation. Elections are also called after a dissolution of the House of Representatives. All elections are direct, except for the Senate (Eerste Kamer), which has 75 members, elected for a four-year term by provincial councillors on the basis of proportional representation at the provincial elections.
The Netherlands has a multi-party system, with numerous parties, in which usually no one party ever secures an overall majority of votes (except occasionally in very small municipalities, such as in Tubbergen), so that several parties must cooperate to form a coalition government. This usually includes the party supported by a plurality of voters, with only three exceptions since World War II, in 1971, 1977 and 1982, when the Dutch Labour Party (PvdA) was the largest party but did not take part in the coalition.
Candidates to the elections of the House of Representatives are chosen from party lists according to a system of proportional representation. The threshold is 1/150th of the total number of valid votes.
During the municipal elections of 2006, elections were electronic throughout the country. As a result, results were known before the end of the day, a mere two hours after the closing of the poll stations. For the national elections in November of that same year, however, several polling stations decided to return to paper and red pencil because of security issues with the voting machines. Since then, most elections have been held using paper and pencil.
The most recent election were the provincial elections on 18 March 2015.
Timing
The maximum parliamentary term is five years[1] and elections are generally held about four years after the previous one. Normal elections, i.e. after the House of Representatives has fulfilled its term, take place in March. If municipal or provincial elections are already taking place in March of that year, the parliamentary elections are postponed to May. The elections are planned for spring to ensure that a new cabinet is formed in time to present its plans on the most important day in the Dutch Parliament, Prinsjesdag.[2] If the House of Representatives is dissolved, due to a severe conflict between the House of Representatives and cabinet, or within the cabinet, new elections (called dissolution elections) take place as soon as possible, usually two months to give parties time to prepare. The term of the next House can be shortened or prolonged by almost a year to ensure the next normal elections again happen in March or May.
Municipal and provincial elections always take place every four years, in March; municipal elections always two years after a year divisible by four, and provincial elections one year after municipal elections. City councils and States-Provincial cannot be dissolved, so no dissolution elections can occur. An exception to the four-year term is made when two or more municipalities merge and new elections take place for the merged municipality. Senate elections also take place every four years, in May following the provincial elections. The Senate can be dissolved, and subsequently dissolution elections take place, but since the States-Provincial remain the same, this seldom occurs. A Senate chosen by dissolution elections sits out the remainder of its predecessor's term.
Elections usually take place on Wednesdays, but the government can decide to change this to a Tuesday, Thursday or Friday if there are good reasons to do so (e.g. when the election day coincides with a national holiday). Elections for the European Parliament always take place on a Thursday.
Eligibility
Every Dutch citizen who has reached the age of 18 is eligible to vote (actief kiesrecht) or to stand for election as a member of the House of Representatives (passief kiesrecht). A notable exception is municipal elections, in which persons younger than 18 can be elected, although they may not take their seat until their 18th birthday. Also, for the municipal election one does not have to be Dutch; residents who are citizens of another EU country are also eligible to vote, as well as citizens of other countries who have lived (legally) in the Netherlands for five years. Someone may be deprived of these rights if they are mentally incapable of making a reasoned choice or have lost their right to vote by court sentence. Two weeks before an election all voters receive a card, which is the evidence that they are entitled to vote, and this card must be handed over at the polling-station before voting. Voting is not compulsory. Compulsory voting was introduced along with universal suffrage in 1917, but it was abolished in 1967.
It is not necessary or even possible specifically to register as a voter for elections in the Netherlands: every resident inhabitant of the Netherlands is required to register as such with the municipality in which they are living, and this data (which includes their nationality and date of birth) is the basis from which the electoral register is derived.
Dutch citizens who live abroad (and have deregistered themselves as a Dutch resident) are allowed to vote for the House of Representatives and for the European Parliament, but not for municipal or provincial elections. They do need to register themselves as a voter.
System
As described above, the House of Representatives is elected using an open party list system of proportional representation.
Election

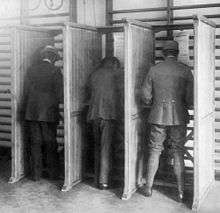
For all elections polling is organized on the basis of municipalities. In each municipality there are multiple voting stations, usually in communal buildings, such as churches, schools, and more recently, railway stations. There are two different systems: using the call-to-vote card (oproepkaart) or a voting pass (stempas). With the oproepkaart, voters may vote, using this card, only at their nearest voting station, or if lost, their identity card. With a stempas, users may vote at any station in their municipality, but must have the pass with them. If it is lost, a replacement can be requested, but only until a few days before the elections. A stempas (of different type) can also be requested to vote in a different municipality.
When arriving at a voting station, voters hand in their card or pass to one of the three attendants of the voting station, who checks the card, cancels it, issues ballot papers to the voter, and directs him or her to the polling-booth.
Dutch citizens living abroad are able to vote by registering in advance and then using a postal vote. The results are counted by the municipality of The Hague and included in its own results. In 2006, they could vote over the internet via the Rijnland Internet Election System, but in 2008 security concerns led to a law against Internet voting.[3]
Voting is done in one of two ways: manually marking a ballot paper with a red pencil or electronically, using a voting machine. In 2005, almost all municipalities planned to abandon pencil-and-paper voting. However, serious doubts were raised over the inviolability of the computers used from potential vote tampering and electronic eavesdropping.[4][5] This led to a run on foreign voting machines and reintroduction of the red pencil in some municipalities in 2006, occasionally using converted medical waste disposal containers as voting boxes.
Post-election
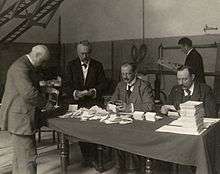
Polls close at 21:00 and the votes are counted immediately. For national elections, the first results usually come within the first five minutes after the polls are closed (from the municipalities with the fewest inhabitants, Schiermonnikoog and Renswoude). The final results are generally known around midnight and semi-officially announced the next morning, after which the 150 seats are allocated. However, recounting over the course of the following days sometimes throws up minor shifts in the allocation of seats.
Seat assignment
The electorate in the Netherlands during the last general elections in 2012 was 12,689,810, of whom 75% voted, resulting in 9,462,223 votes (of which 9,424,235 valid votes). With 150 seats, that means a quota of 62,828 votes per seat, the so-called Hare quota. Since the electoral threshold is equal to the quota, that is also the number of votes required to get one seat in the House of Representatives.
However, the way residual seats are assigned, by using the D'Hondt method, a highest averages method, means that smaller parties are unlikely to get a residual seat, while larger parties have a bigger chance of getting one and may even get more than one. Firstly, numbers of seats are always rounded down, meaning there are always residual seats and parties that did not reach the quota do not get any seats (they do not take part in the following calculation). Next, the number of votes is divided by the assigned seats plus one. The party with the highest resulting number then gets one extra seat. Next, the process is repeated, with the party that got the extra seat participating again, albeit with a number one higher because they got an extra seat (the calculation stays the same for the other parties, which got no extra seat). But later on in the process, that party may get another extra seat. And since there are many parties in the House of Representatives, this is not unlikely to happen.
For example, in 2003 (see table here), the three biggest parties each got two of the six residual seats, even the VVD (150*0.179=26.85, but they got 28 seats, representing 18.7% of the seats instead of 17.9%), whereas the Socialist Party got none (150*0.063 = 9.45, but they got only 9 seats, representing 6% of the seats instead of 6.3%).
When the largest party gets over 35% of the votes and is considerably bigger than the next biggest party, that party may even get as much as 3 or even 4 residual seats. This has, however, never happened. The percentage of votes for the biggest party is usually around 30% and rarely goes far beyond that. The largest result ever was at the 1989 elections, when CDA got 35.3% of the votes. Even then, however, CDA only got two residual seats because next biggest party (PvdA) had 31.9% of the votes. The biggest difference between the first and second party was at the 2002 elections, the most dramatic elections in Dutch history, when especially PvdA lost many votes to LPF, which became second biggest after CDA with 17.0% of the votes. CDA, however, had only 27.9% of the votes and therefore still only got 2 residual seats.
Parties may, however, form an alliance (lijstencombinatie), in which case they participate in the above calculations as one party and get a bigger chance of gaining residual seats (or getting one in the first place). The division of those seats between those parties is, however, done in a different way, by using the largest remainder method, which favours the smaller parties rather than the bigger ones if there is a considerable difference in size. But the overall advantage is greatest for small parties of comparable size.
Assigning people to seats
After seats are assigned to the parties, people have to be assigned to the seats. The Netherlands has 20 electoral districts, in each of them a party can use different lists. In theory, a party can place different candidates on each of the 20 different lists. However, it is usual that at least the candidate ranked first on the list is the same person throughout the country. It is even quite common that parties use the same list in every district, or vary only the last five candidates per district. Usually these five candidates are locally well known politicians, parties hope to attract extra votes with these candidates. However, because of their low position on the list, chances are low that these local candidates are elected.
The first step in the process of assigning people to the seats is calculating how many seats each of the different lists of a party gets, by adding the number of votes on each of the different lists together. If a party used the same list in more than one electoral district, these lists are seen as one list. Seat assignment to the different lists is done by using the largest remainder method.
The second step is calculating which candidate received on his or her own more votes than 25% of the electoral quota, by adding up all votes for a particular candidate on the different lists. These candidates are declared elected independent of the list order, and get one of the seats of the list where they received the most votes. If more candidates are elected on a list than the list received seats, the candidate with the lowest total number of votes is transferred to the list where he had his second best result.
As a third step, the remaining seats (if there are any) are assigned to the remaining candidates, based on their order on the list. When candidates are elected on more than one list in this way, the candidate gets the seat on the list where he or she received the most votes. This is continued until every seat is assigned. If one of these elected candidates later decides to leave parliament, then his seat is assigned to the next person on the list of the district he 'represents'.
An exception to the above exists in the form of lijstduwer ('list pushers'), famous people (former politicians, but also sports people) who are put on the candidate list but will not accept a seat when they get enough votes for one. During the municipal elections in 2006 professor Joop van Holsteyn criticised this practise, saying someone on a candidate list should also be a serious candidate. This view is shared by other politicologists, but less so by politicians, who say that lijstduwers are on the list not to get elected but to show that they support that party and that the fact that they are at the bottom of the list makes it obvious they are not intended to get a seat. Still, writer Ronald Giphart (1998) and skater Hilbert van der Duim (1994) got a city council seat, which Giphart refused to fill. Professor Rudy Andeweg says this is close to fraud because the law requires someone on the candidate list to declare in writing to be willing to fill a seat.
An example from the municipality of Oude IJsselstreek. The city council elections of 2010 resulted a total of 17.852 valid votes. The CDA party achieved 4.440 votes. Of the thirty CDA candidates on the list, 22 were given at least one vote each:[6]
- van de Wardt, P. 2.061
- Aalbers-van Ham, A.A.F.J. 224
- Steentjes, B.W.J. 451
- Bergevoet, R.J.W.M. 245
- Tekinerdoğan, M. 417
- Ermers-Mulder, A.G.M. 66
- Hettinga, M.A.J. 99
- Toussaint, C.P. 29
- van Bergen, J.H. 37
- Berentschot, H.J. 77
- Hendriksen-Löverink, S.A.M. 150
- Büchner, A.C.A. 31
- Sorgedrager-Carreira da Cunha Sant'Anna Sorgedrager, M.P. 22
- Hakvoort, G.W.M. 219
- Lammers-te Lindert, E.H.A. 19
- Vesters, J.M.G.M. 28
- Rootmensen-Bulsink, J.W. 45
- Ross, A.G.M. 59
- Koskamp, A.H. 35
- Roelofs, W.T.H.M. 91
- Ernst, F.F.J. 15
- Löverink, B.A.S. 20
(The last number is the amount of personal votes.)
As the total number of votes in the municipality is 17,852 and the council has 27 seats, 661 votes count for one seat. As the CDA has 4,440 votes it is entitled to seven seats.
First, it has to be checked who of the CDA candidates has more than a quarter of the kiesdeler. (661 divided by four makes 165 votes.) This is true for the candidates number 1, 3, 5, 4, 2 and 14 (in this order). Those six are elected.
Second, the rest of the CDA seats (one) is given to the person first on the list. As candidates number 1-5 already have seats, this last seat goes to number 6.
Referendums
Since 1 July 2015, most laws can be subjected to a consultative referendum after their approval, following a request by 300 000 people.
Before that date in principle, there was no permanent provision in law for a referendum. However, from 2002 until 2005, there was a Temporary Referendum Law in place, which allowed for non-binding referendums, known in Dutch as Volksraadpleging ("People's Consultation"), to be organised for laws already approved by the House of Representatives. No referendum was called based on this law.
In order to hold the 2005 referendum on the Treaty establishing a Constitution for Europe, a different law was temporarily put in place. That referendum was the first national referendum in the Netherlands since 1805 referendum in Batavian Republic and it was the result of an initiative proposal by parliamentarians Farah Karimi (Greens), Niesco Dubbelboer (Labour) and Boris van der Ham (Democrats).
Other elections
Water boards
Elections for the water boards have some similarities to other elections mentioned above, but also some distinctive differences. Similar to e.g. municipal elections, there are national parties and local parties, and the party list system is used with proportional representation. Residents of 18 and over can vote and elections take place every four years.
In contrast to other elections, not all members of the water board are chosen by the residents of the water board area. The members of each water board are divided into four categories: inhabitants, agriculture, nature and commercial. Only board members in the inhabitants category are chosen in direct elections, the members in the other categories are appointed by representing organisations, e.g. chambers of commerce in the commercial category. Since 2015, residents vote in person, just like in other elections, and they take place every four years, on the same day as the provincial elections. Before 2015, votes were cast by post, over a period of about two weeks.
Island councils
The elections for the Island councils for the special municipalities of Bonaire, Sint Eustatius, and Saba take place at the same date as the provincial elections;[7] for the first time in 2015.
Latest elections
Dutch general elections 2012
| Party | Lijsttrekker | Votes | % | +/– | Seats | +/– | |||
|---|---|---|---|---|---|---|---|---|---|
| People's Party for Freedom and Democracy | Mark Rutte | 2,504,948 | 26.6 | +6.1 | 41 | +10 | |||
| Labour Party | Diederik Samsom | 2,340,750 | 24.8 | +5.2 | 38 | +8 | |||
| Party for Freedom | Geert Wilders | 950,263 | 10.1 | -5.4 | 15 | -9 | |||
| Socialist Party | Emile Roemer | 909,853 | 9.7 | -0.2 | 15 | 0 | |||
| Christian Democratic Appeal | Sybrand van Haersma Buma | 801,620 | 8.5 | -5.1 | 13 | -8 | |||
| Democrats 66 | Alexander Pechtold | 757,091 | 8.0 | +1.1 | 12 | +2 | |||
| Christian Union | Arie Slob | 294,586 | 3.1 | -0.1 | 5 | 0 | |||
| GreenLeft | Jolande Sap | 219,896 | 2.3 | -4.3 | 4 | -6 | |||
| Reformed Political Party | Kees van der Staaij | 196,780 | 2.1 | +0.4 | 3 | +1 | |||
| Party for the Animals | Marianne Thieme | 182,162 | 1.9 | 0.6 | 2 | 0 | |||
| 50PLUS | Henk Krol | 177,631 | 1.9 | - | 2 | - | |||
| Pirate Party | Dirk Poot | 30,600 | 0.3 | +0.2 | 0 | 0 | |||
| Party for Human and Spirit | Lea Manders | 18,310 | 0.2 | -0.1 | 0 | 0 | |||
| Sovereign Independent Pioneers Netherlands | Johan Oldenkamp | 12,982 | 0.1 | – | 0 | – | |||
| Party of the Future | Johan Vlemmix | 8,194 | 0.1 | – | 0 | – | |||
| Democratic Political Turning Point | Hero Brinkman | 7,363 | 0.1 | – | 0 | – | |||
| Libertarian Party | Toine Manders | 4,163 | 0.0 | – | 0 | – | |||
| Netherlands Local | Ton Schijvenaars | 2,842 | 0.0 | – | 0 | – | |||
| Liberal Democratic Party | Sammy van Tuyll van Serooskerken | 2,126 | 0.0 | – | 0 | – | |||
| Anti-Europe Party | Arnold Reinten | 2,013 | 0.0 | – | 0 | – | |||
| Political Party NXD | Anil Samlal | 62 | 0.0 | – | 0 | – | |||
| Total valid votes | 9,424,235 | 100 | – | 150 | – | ||||
| Invalid/blank votes | 37,988 | 0.4 | |||||||
| Total | 9,462,223 | 100 | |||||||
| Registered voters/turnout | 12,689,810 | 74.6 | |||||||
| Source: Verkiezingsuitslagen, Kerngegevens Tweede Kamerverkiezing 2012. Nederlandse Kiesraad. 17 September 2012. Retrieved 2 October 2012. | |||||||||
Dutch senate elections 2015
The Senate is elected indirectly, by the provincial councillors (who are themselves chosen in direct elections). It is composed as follows:
| Parties | Seats 2015 | Seats 2011 | Seats 2007 | Seats 2003 | Seats 1999 | Seats 1995 | Seats 1991 |
|---|---|---|---|---|---|---|---|
| People's Party for Freedom and Democracy (VVD) | 13 | 16 | 14 | 15 | 19 | 23 | 12 |
| Christian Democratic Appeal (CDA) | 12 | 11 | 21 | 23 | 20 | 19 | 27 |
| Democrats 66 (D66) | 10 | 5 | 2 | 3 | 4 | 7 | 12 |
| Party for Freedom (PVV) | 9 | 10 | |||||
| Socialist Party (SP) | 9 | 8 | 12 | 4 | 2 | 1 | |
| Labour Party (PvdA) | 8 | 14 | 14 | 19 | 15 | 14 | 16 |
| GreenLeft (GL) | 4 | 5 | 4 | 5 | 8 | 4 | 4 |
| Christian Union (CU) | 3 | 2 | 4 | 2 | 4 | 2* | 2* |
| Party for the Animals (PvdD) | 2 | 1 | 1 | ||||
| Political Reformed Party (SGP) | 2 | 1 | 2 | 2 | 2 | 2 | 2 |
| 50PLUS (50+) | 2 | 1 | |||||
| Independent Senate Group (OSF) | 1 | 1 | 1 | 1 | 1 | 1 | |
| Pim Fortuyn List (LPF) | 1 | ||||||
| General Elderly Alliance (AOV) | 2 | ||||||
| Total | 75 | 75 | 75 | 75 | 75 | 75 | 75 |
* Reformatory Political Federation (RPF) and Reformed Political League (GPV)
Dutch European Parliament elections 2014
| Lists | Votes | % | Change | Seats | Change | |||||
|---|---|---|---|---|---|---|---|---|---|---|
| List | National Party | EU Party | EP Group | |||||||
| list | Christian Democratic Appeal | Christen-Democratisch Appèl | EPP | EPP | 713.767 | 15,0 | −4,8 | 5 | ±0 | |
| list | Democrats 66 | Democraten 66 | ELDR | ALDE | 732.145 | 15,4 | +4,0 | 4 | +1 | |
| list | Party for Freedom | Partij voor de Vrijheid | none | NI | 630.139 | 13,3 | -3,5 | 4 | ±0 | |
| list | People's Party for Freedom and Democracy | Volkspartij voor Vrijheid en Democratie | ELDR | ALDE | 567.903 | 12,0 | +0,6 | 3 | ±0 | |
| list | Labour Party | Partij van de Arbeid | PES | S&D | 444.388 | 9,4 | −2,6 | 3 | ±0 | |
| list | Socialist Party | Socialistische Partij | none | EUL/NGL | 455.505 | 9,6 | +2,5 | 2 | ±0 | |
| list | GreenLeft | GroenLinks | EGP | Greens-EFA | 329.906 | 6,9 | -1,9 | 2 | -1 | |
| list | ChristianUnion – Reformed Political Party | ChristenUnie–SGP | ECPM / none | ECR / EFD | 310.540 | 6,8 | +0,9 | 2 | ±0 | |
| list | Party for the Animals | Partij voor de Dieren | none | 199.438 | 4,2 | +0,6 | 1 | +1 | ||
| list | 50PLUS | 50PLUS | none | 174.466 | 3,7 | +3,7 | 0 | ±0 | ||
| list | Pirate Party | Piratenpartij | none | none | 40.064 | 0,8 | +0,8 | 0 | ±0 | |
| list | Article 50 | Artikel 50 | none | none | 23.945 | 0,5 | +0,5 | 0 | ±0 | |
| list | Anti EU(ro) Partij | none | 12.210 | 0,3 | +0,3 | 0 | ±0 | |||
| list | The Greens | De Groenen | EGP | none | 10.835 | 0,2 | +0,04 | 0 | ±0 | |
| list | Liberal Democratic Party | Liberaal Democratische Partij | none | 6.327 | 0,1 | -0,1 | 0 | ±0 | ||
| Total votes | 4.720.600 | 100 | 26 | +1 | ||||||
| Turnout | 37,3 | +0,5 | ||||||||
| Source: [8] | ||||||||||
Municipal elections 2014
The 2014 Dutch municipal election saw a success for local parties, who increased their share to 30% of the votes. The Christian Democratic Appeal remained the largest party nationally, earning 14% of the votes. D66 and SP also saw significant rises compared to the 2010 elections, getting 12% and 7% respectively. VVD, although still ranked third nationwide, lost significantly compared to the 2010 elections, winning 12% of the votes. The undisputed loser of the elections, however, was the PvdA, getting 10% of the votes and losing its majority in Amsterdam.[9]
Next elections
The next elections in the Netherlands are planned for (in chronological order):[10]
- House of Representatives: 15 March 2017
- Municipalities: 21 March 2018
- European Parliament: 23 May 2019 (tentative date)
Election results and cabinets since World War II
The following tables show the national election results and cabinets in the Netherlands since World War II. Per table, only parties that ever got seats over that period are listed (the number of participating parties in Dutch national elections is usually around 20).
The numbers give the number of seats for each party. The total number of seats in parliament is 150, so a coalition needs at least 76 seats for a majority.
In each table, the parties are split in three groups; parties that have been in government, minor parties and extinct parties. Within each group, the parties are grouped roughly according to the scheme leftwing - christian - rightwing.
| columns | |||
| Elections | Election years (linking to the relevant articles) | ||
| sc | 'seat change'; the number of seats that changed between parties. Numbers between brackets assume merging parties to be the same as the new party | ||
| Cabinet | The resulting cabinets (not necessarily in the same year) | ||
| Term | The duration of the term of that cabinet, in months | ||
| % | percentage of seats held by the government parties. (Note that the other numbers are seats, not percentages.) | ||
| cells | |||
| bold | party in cabinet (government) | ||
| - | not enough votes to get a seat in parliament | ||
|
|
party didn't exist then or did not participate nationally | ||
|
|
no elections |
Party name abbreviations
GrL = GroenLinks (a merger of PPR, PSP, CPN and EVP)
ChU = ChristenUnie (a merger of RPF and GVP)
| Elections | sc | Cabinet | Term (months) |
% | PvdA | D66 | CU | CDA | VVD | SP | GrL | PvdD | SGP | PVV | 50PLUS | CPN | PSP | PPR | EVP | DS70 | RPF | GPV | BP | LN | AOV | U55 | CP | CD | LPF | ||||
| 2012 | ? | Rutte II | ? | ? | 38 | 12 | 5 | 13 | 41 | 15 | 4 | 2 | 3 | 15 | 2 | ||||||||||||||||||
| 2010 | ? | Rutte I(3) | ? | 35 | 30 | 10 | 5 | 21 | 31 | 15 | 10 | 2 | 2 | 24 | |||||||||||||||||||
| 2006 | 30 | Balkenende IV | 44 | 53 | 33 | 3 | 6 | 41 | 22 | 25 | 7 | 2 | 2 | 9 | - | ||||||||||||||||||
| - | - | Balkenende III(1) | 7 | 48 | 42 | 6 | 3 | 44 | 28 | 9 | 8 | 2 | 8 | ||||||||||||||||||||
| 2003 | 24 | Balkenende II | 38 | 52 | 42 | 6 | 3 | 44 | 28 | 9 | 8 | 2 | 8 | ||||||||||||||||||||
| 2002 | (36) | Balkenende I | 10 | 62 | 23 | 7 | 4 | 43 | 24 | 9 | 10 | 2 | << ChU | 2 | 26 | ||||||||||||||||||
| 1998 | 25 | Kok II | 47 | 65 | 45 | 14 | 29 | 38 | 5 | 11 | 3 | 3 | 2 | ||||||||||||||||||||
| 1994 | 34 | Kok I | 48 | 61 | 37 | 24 | 34 | 31 | 2 | 5 | 2 | 3 | 2 | 6 | 1 | 3 | |||||||||||||||||
| 1989 | (8) | Lubbers III | 57 | 69 | 49 | 12 | 54 | 22 | - | 6 | 3 | << GrL | 1 | 2 | 1 | ||||||||||||||||||
| 1986 | 17 | Lubbers II | 40 | 54 | 52 | 9 | 54 | 27 | - | 3 | - | 1 | 2 | - | 1 | 1 | - | - | |||||||||||||||
| 1982 | 15 | Lubbers I | 44 | 54 | 47 | 6 | 45 | 36 | - | 3 | 3 | 3 | 2 | 1 | - | 2 | 1 | 1 | |||||||||||||||
| - | - | van Agt III(1) | 5 | 43 | 44 | 17 | 48 | 26 | - | 3 | 3 | 3 | 3 | - | 2 | 1 | |||||||||||||||||
| 1981 | 14 | van Agt II | 8 | 73 | 44 | 17 | 48 | 26 | - | 3 | 3 | 3 | 3 | - | 2 | 1 | |||||||||||||||||
| 1977 | (19) | Van Agt I | 45 | 51 | 53 | 8 | 49 | 28 | - | 3 | 2 | 1 | 3 | 1 | - | 1 | 1 | ||||||||||||||||
In 1977, KVP, ARP and CHU merged into CDA.
DS'70 split off from PvdA
KNP is former Lijst Welter, which split off from KVP in 1948, but returned to that party in 1955
PvdV is the forerunner of VVD
| Elections | sc | Cabinet | Term (months) |
% | PvdA | DS70 | D66 | PPR | KVP | ARP | CHU | VVD | CPN | PSP | SGP | GPV | RKPN | BP | NMP | KNP | PvdV | |||||
| 1972 | 20 | Den Uyl(2) | 55 | 65 | 43 | 6 | 6 | 7 | 27 | 14 | 7 | 22 | 7 | 2 | 3 | 2 | 1 | 3 | - | |||||||
| - | - | Biesheuvel II(1) | 9 | 49 | 39 | 8 | 11 | 2 | 35 | 13 | 10 | 16 | 6 | 2 | 3 | 2 | 1 | 2 | ||||||||
| 1971 | 19 | Biesheuvel I | 13 | 55 | 39 | 8 | 11 | 2 | 35 | 13 | 10 | 16 | 6 | 2 | 3 | 2 | 1 | 2 | ||||||||
| 1967 | 15 | De Jong | 51 | 57 | 37 | 7 | 42 | 15 | 12 | 17 | 5 | 4 | 3 | 1 | 7 | |||||||||||
| - | - | Zijlstra(1) | 4 | 42 | 43 | 50 | 13 | 13 | 16 | 4 | 4 | 3 | 1 | 3 | ||||||||||||
| - | - | Cals | 19 | 71 | 43 | 50 | 13 | 13 | 16 | 4 | 4 | 3 | 1 | 3 | ||||||||||||
| 1963 | 9 | Marijnen | 21 | 61 | 43 | 50 | 13 | 13 | 16 | 4 | 4 | 3 | 1 | 3 | ||||||||||||
| 1959 | 8 | De Quay | 50 | 50 | 48 | 49 | 14 | 12 | 19 | 3 | 2 | 3 | - | - | ||||||||||||
| - | - | Beel II(1) | 5 | 51 | 50 | 49 | 15 | 13 | 13 | 7 | 3 | - | ||||||||||||||
| expansion from 100 to 150 seats | - | 85 | 50 | 49 | 15 | 13 | 13 | 7 | 3 | - | ||||||||||||||||
| 1956 | 7 | Drees IV | 26 | 85 | 34 | 33 | 10 | 8 | 9 | 4 | 2 | - | ||||||||||||||
| 1952 | 6 | Drees III | 49 | 81 | 30 | 30 | 12 | 9 | 9 | 6 | 2 | - | 2 | |||||||||||||
| - | - | Drees II | 18 | 76 | 27 | 32 | 13 | 9 | 8 | 8 | 2 | - | 1 | |||||||||||||
| 1948 | (4) | Drees I | 31 | 76 | 27 | 32 | 13 | 9 | 8 | 8 | 2 | - | 1 | |||||||||||||
| 1946 | ? | Beel I | 25 | 61 | 29 | 32 | 13 | 8 | 10 | 2 | 6 | |||||||||||||||
| - | ? | Schermerhorn-Drees(2) | 13 | (no elections - appointed by queen) | ||||||||||||||||||||||
| 1940-1945: War cabinets without elections | ||||||||||||||||||||||||||
(1) minority caretaker cabinet
(2) extra-parliamentary cabinet
(3) minority cabinet
See also
- Electoral calendar
- Electoral system
- Electronic voting examples#Netherlands
- Historic composition of the House of Representatives of the Netherlands
- Politics of the Netherlands
References
- ↑ Article 64.4 of the Dutch constitution
- ↑ Tweede Kamer. "Kamerstuk Tweede Kamer 1984–1985 kamerstuknummer 18807 ondernummer 2" (in Dutch). Staten-Generaal Digitaal. p. 12. Retrieved 24 March 2011.
- ↑ Jacobs, B.; Pieters, W. (2009). "Electronic Voting in the Netherlands: From Early Adoption to Early Abolishment". Foundations of Security Analysis and Design V. Lecture Notes in Computer Science. 5705. p. 121. doi:10.1007/978-3-642-03829-7_4. ISBN 978-3-642-03828-0.
- ↑ "Wij vertrouwen stemcomputers niet".
- ↑ "EenVandaag :: het nieuws- en actualiteiten programma van AVROTROS op NPO 1".
- ↑ "Uitslag gemeenteraadsverkiezingen".
- ↑ (Dutch) Kiesraad about eilandsraden
- ↑ Volg de verkiezingen 2014 live op Parool.nl Parool, 27 May 2014
- ↑ "D66 claims most of the big cities, coalition party support slides". DutchNews.nl.
- ↑ "Verkiezingskalender".
External links
| Wikimedia Commons has media related to Elections in the Netherlands. |
- Adam Carr's Election Archive
- latest election (with party logos)
- election results, national results since 1850 and results of provincial elections 2nd half 20th century
- Dutch election results, national results since 1918, by province.
- Interview/NSS Weekly Electoral Poll
- Peil.nl Weekly Electoral Poll
- NSD: European Election Database – Netherlands publishes regional level election data (NUTS 1–3); allows for comparisons of election results, 1994–2010
| General elections |
|
|---|---|
| Provincial elections | |
| Municipal elections | |
| European elections | |
| Referendums | |
| |