Dutch general election, 1971
Dutch general election, 1971

|
|
|
|
All 150 seats to the House of Representatives
76 seats were needed for a majority |
| Turnout |
79.1% |
| |
First party |
Second party |
Third party |
| |
 |
 |
_-_NL-HaNA_Anefo_933-4498_WM566.jpg) |
| Leader |
Joop den Uyl |
Gerard Veringa |
Molly Geertsema |
| Party |
PvdA |
KVP |
VVD |
| Leader since |
1966 |
1971 |
1969 |
| Last election |
37 seats, 23.5% |
42 seats, 26.5% |
17 seats, 10.7% |
| Seats won |
39 |
35 |
16 |
| Seat change |
 2 2 |
 7 7 |
1 |
| Popular vote |
1,552,276 |
1,380,539 |
653,092 |
| Percentage |
24.5% |
21.8% |
10.3% |
|
| |
Fourth party |
Fifth party |
Sixth party |
| |
 |
.jpg) |
 |
| Leader |
Barend Biesheuvel |
Hans van Mierlo |
Berend Jan Udink |
| Party |
ARP |
D66 |
CHU |
| Leader since |
1963 |
1966 |
1970 |
| Last election |
15 seats, 9.9% |
7 seats, 4.4% |
10 seats, 6.3% |
| Seats won |
13 |
11 |
7 |
| Seat change |
2 |
4 |
3 |
| Popular vote |
542,780 |
427,720 |
354,463 |
| Percentage |
8.5% |
6.7% |
4.4% |
|
| |
Seventh party |
Eighth party |
Ninth party |
| |
 |
 |
 |
| Leader |
Willem Drees, Jr. |
Marcus Bakker |
Hette Abma |
| Party |
DS'70 |
CPN |
SGP |
| Leader since |
1971 |
1963 |
1971 |
| Last election |
First Election |
5 seats, 3.6% |
3 seats, 2.0% |
| Seats won |
8 |
6 |
3 |
| Seat change |
8 |
1 |
 0 0 |
| Popular vote |
336,282 |
246,299 |
148,282 |
| Percentage |
5.3% |
3.8% |
2.3% |
|
|
| Seats |
|
|
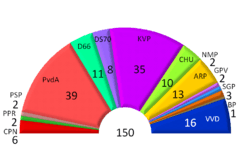
General elections were held in the Netherlands on 28 April 1971.[1] The Labour Party emerged as the largest party, winning 39 of the 150 seats in the House of Representatives.[2] The election was the first without mandatory voting, causing a sharp fall in voter turnout, down to 79.1% from 94.9% at the 1967 elections.[3] Barend Biesheuvel of the Anti Revolutionary Party became Prime Minister, leading the first Biesheuvel cabinet.
Results
| Party |
Votes |
% |
Seats |
+/– |
|---|
| Labour Party | 1,554,280 | 24.6 | 39 | +2 |
| Catholic People's Party | 1,379,672 | 21.8 | 35 | –7 |
| People's Party for Freedom and Democracy | 653,370 | 10.3 | 16 | –1 |
| Anti Revolutionary Party | 542,742 | 8.6 | 13 | –2 |
| Democrats 1966 | 428,067 | 6.8 | 11 | +4 |
| Christian Historical Union | 399,106 | 6.3 | 10 | –2 |
| Democratic Socialists '70 | 336,714 | 5.3 | 8 | New |
| Communist Party of the Netherlands | 246,569 | 3.9 | 6 | +1 |
| Reformed Political Party | 148,192 | 2.3 | 3 | 0 |
| Political Party of Radicals | 116,049 | 1.8 | 2 | New |
| Reformed Political League | 101,790 | 1.6 | 2 | +1 |
| New Middle Party | 95,706 | 1.5 | 2 | New |
| Pacifist Socialist Party | 90,738 | 1.4 | 2 | –2 |
| Farmers' Party | 69,656 | 1.1 | 1 | –6 |
| General Elderly Party of the Netherlands | 155,496 | 2.3 | 0 | New |
| Elderly Party 65+ | 0 | New |
| Elderly Party General Interest | 0 | New |
| Elderly and Labour Party | 0 | New |
| Binding Right | 0 | New |
| Democrats 2000 | 0 | New |
| Kabouters | 0 | New |
| Rural Party for the Elderly | 0 | New |
| Van Velsen List | 0 | New |
| Netherlands Appeal | 0 | New |
| New Roman Party | 0 | New |
| Positive Social Democrats | 0 | New |
| Party of the Right | 0 | 0 |
| Stichting Gedupeerde Groepen 18+ t/m 65+ | 0 | New |
| Invalid/blank votes | 46,567 | – | – | – |
| Total | 6,364,719 | 100 | 150 | 0 |
| Registered voters/turnout | 8,048,726 | 79.1 | – | – |
| Source: Nohlen & Stöver |
| Popular Vote |
|---|
|
|
|
|
|
| PvdA |
|
24.60% |
| KVP |
|
21.84% |
| VVD |
|
10.34% |
| ARP |
|
8.59% |
| D66 |
|
6.78% |
| CHU |
|
6.32% |
| DS70 |
|
5.33% |
| CPN |
|
3.90% |
| SGP |
|
2.35% |
| PPR |
|
1.84% |
| GPV |
|
1.61% |
| NMP |
|
1.51% |
| PSP |
|
1.44% |
| BP |
|
1.10% |
| Other |
|
2.46% |
References