Electromagnetic absorption by water
The absorption of electromagnetic radiation by water depends on the state of the water.
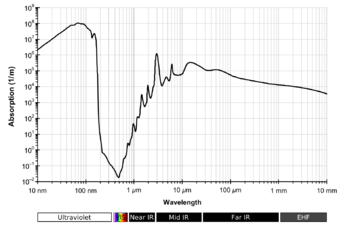
The absorption in the gas phase occurs in three regions of the spectrum. Rotational transitions are responsible for absorption in the microwave and far-infrared, vibrational transitions in the mid-infrared and near-infrared. Vibrational bands have rotational fine structure. Electronic transitions occur in the vacuum ultraviolet regions.
Liquid water has no rotational spectrum but does absorb in the microwave region.
Overview
The water molecule, in the gaseous state, has three types of transition that can give rise to absorption of electromagnetic radiation
- Rotational transitions, in which the molecule gains a quantum of rotational energy. Atmospheric water vapour at ambient temperature and pressure gives rise to absorption in the far-infrared region of the spectrum, from about 200 cm−1 (50 μm) to longer wavelengths towards the microwave region.
- Vibrational transitions in which a molecule gains a quantum of vibrational energy. The fundamental transitions give rise to absorption in the mid-infrared in the regions around 1650 cm−1 (μ band, 6 μm) and 3500 cm−1 (so-called X band, 2.9 μm)
- Electronic transitions in which a molecule is promoted to an excited electronic state. The lowest energy transition of this type is in the vacuum ultraviolet region.
In reality, vibrations of molecules in the gaseous state are accompanied by rotational transitions, giving rise to a vibration-rotation spectrum. Furthermore, vibrational overtones and combination bands occur in the near-infrared region. The HITRAN spectroscopy database lists more than 37,000 spectral lines for gaseous H216O, ranging from the microwave region to the visible spectrum.[5][12]
In liquid water the rotational transitions are effectively quenched, but absorption bands are affected by hydrogen bonding. In crystalline ice the vibrational spectrum is also affected by hydrogen bonding and there are lattice vibrations causing absorption in the far-infrared. Electronic transitions of gaseous molecules will show both vibrational and rotational fine structure.
Units
Infrared absorption band positions may be given either in wavelength, micrometers, μm, often shortened to "microns", or wavenumbers per centimeter, cm−1, sometimes referred to as reciprocal centimeters. Since there are 104 micrometers in 1 centimeter, the two units are related by
- wavenumber (cm−1) = 104 / wavelength (μm)
Wavenumber per centimeter is the reciprocal of the wavelength in cm.
Rotational spectrum
The water molecule is an asymmetric top, that is, it has three independent moments of inertia. Consequently, the rotational spectrum has no obvious structure. A large number of transitions can be observed; lines due to atmospheric water vapor can easily be observed from about 50 μm (200 cm−1) to longer wavelengths. Measurements of microwave spectra have provided a very precise value for the O-H bond length, 95.84 ± 0.05 pm and H-O-H bond angle, 104.5 ± 0.3°.[13]
Vibrational spectrum
3657 cm−1 (2.734 μm)
1595 cm−1 (6.269 μm)
3756 cm−1 (2.662 μm)
The water molecule has three fundamental molecular vibrations. The O-H stretching vibrations give rise to absorption bands with band origins at 3657 cm−1 (ν1, 2.734 μm) and 3756 cm−1 (ν3, 2.662 μm) in the gas phase. The asymmetric stretching vibration, of B2 symmetry in the point group C2v is a normal vibration. The H-O-H bending mode origin is at 1595 cm−1 (ν2, 6.269 μm). Both symmetric stretching and bending vibrations have A1 symmetry, but the frequency difference between them is so large that mixing is effectively zero. In the gas phase all three bands show extensive rotational fine structure.[14] ν3 has a series of overtones at wavenumbers somewhat less than n ν3, n=2,3,4,5... Combination bands, such as ν2 + ν3 are also easily observed in the near infrared region.[15][16] The presence of water vapor in the atmosphere is important for atmospheric chemistry especially as the infrared and near infrared spectra are easy to observe. Standard (atmospheric optical) codes are assigned to absorption bands as follows. 0.718 μm (visible): α, 0.810 μm: μ, 0.935 μm: ρστ, 1.13 μm: φ, 1.38 μm: ψ, 1.88 μm: Ω, 2.68 μm: X. The gaps between the bands define the infrared window in the Earth's atmosphere.[17]
The infrared spectrum of liquid water is dominated by the intense absorption due to the fundamental O-H stretching vibrations. Because of the high intensity, very short path lengths, usually less than 50 μm, are needed to record the spectra of aqueous solutions. There is no rotational fine structure, but the absorption band are broader than might be expected, because of hydrogen bonding.[18] Peak maxima for liquid water are observed at 3450 cm−1 (2.898 μm), 3615 cm−1 (2.766 μm) and 1640 cm −1 (6.097 μm).[14] Direct measurement of the infrared spectra of aqueous solutions requires that the cuvette windows be made of substances such as calcium fluoride which are water-insoluble. This difficulty can be overcome by using an attenuated total reflectance (ATR) device.
In the near-infrared range liquid water has absorption bands around 1950 nm (5128 cm−1), 1450 nm (6896 cm−1), 1200 nm (8333 cm−1) and 970 nm, (10300 cm−1).[19][20][15] The regions between these bands can be used in near-infrared spectroscopy to measure the spectra of aqueous solutions, with the advantage that glass is transparent in this region, so glass cuvettes can be used. The absorption intensity is weaker than for the fundamental vibrations, but this is not important as longer path-length cuvettes are used. The absorption band at 698 nm (14300 cm−1) is a 3rd overtone (n=4). It tails off onto the visible region and is responsible for the intrinsic blue color of water. This can be observed with a standard UV/vis spectrophotometer, using a 10 cm path-length. The colour can be seen by eye by looking through a column of water about 10m in length; the water must be passed through an ultrafilter to eliminate color due to Rayleigh scattering which also can make water appear blue.[16][21][22] In both liquid water and ice cluster vibrations occur, which involve the stretching (TS) or bending (TB) of intermolecular hydrogen bonds (O–H . . . O). Bands at wavelengths λ = 50-55 μm (44 μm in ice) have been attributed to TS, intermolecular stretch, and 200 μm (166 μm in ice), to TB, intermolecular bend[11]
The spectrum of ice is similar to that of liquid water, with peak maxima at 3400 cm−1 (2.941 μm), 3220 cm−1 (3.105 μm) and 1620 cm−1 (6.17 μm)[14]
Visible region
| ν1, ν3 | ν2 | wavelength /nm |
|---|---|---|
| 4 | 0 | 742 |
| 4 | 1 | 662 |
| 5 | 0 | 605 |
| 5 | 1 | 550 |
| 6 | 0 | 514 |
| 6 | 1 | 474 |
| 7 | 0 | 449 |
| 7 | 1 | 418 |
| 8 | 0 | 401 |
| 8 | 1 | 376 |
Absorption coefficients for 200 nm and 900 nm are almost equal at 6.9 m−1 (attenuation length of 14.5 cm). Very weak light absorption, in the visible region, by liquid water has been measured using an integrating cavity absorption meter (ICAM).[16] The absorption was attributed to a sequence of overtone and combination bands whose intensity decreases at each step, giving rise to an absolute minimum at 418 nm, at which wavelength the attenuation coefficient is about 0.0044 m−1, which is an attenuation length of about 227 meters. These values correspond to pure absorption without scattering effects. The attenuation of, e.g., a laser beam would be slightly stronger.
Electronic spectrum
The electronic transitions of the water molecule lie in the vacuum ultraviolet region. For water vapor the bands have been assigned as follows.[11]
- 65 nm band - many different electronic transitions, photo-ionization, photodissociation
- discrete features between 115 and 180 nm
- set of narrow bands between 115 and 125 nm
Rydberg series: 1b1 (n2) → many different Rydberg states and 3a1 (n1) → 3sa1 Rydberg state - 128 nm band
Rydberg series: 3a1 (n1) → 3sa1 Rydberg state and 1b1 (n2) → 3sa1 Rydberg state - 166.5 nm band
1b1 (n2) → 4a1 (σ1*-like orbital)
- set of narrow bands between 115 and 125 nm
- At least some of these transitions result in photodissociation of water into H+OH. Among them the best known is that at 166.5 nm.
Microwaves and radio waves
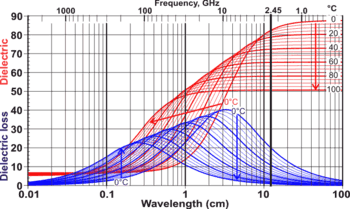
The pure rotation spectrum of water vapor extends into the microwave region.
Liquid water has a broad absorption spectrum in the microwave region, which has been explained in terms of changes in the hydrogen bond network giving rise to a broad, featureless, microwave spectrum.[24] The absorption (equivalent to dielectric loss) is used in microwave ovens to heat food that contains water molecules. A frequency of 2.45 GHz, wavelength 122 mm, is commonly used.
Radiocommunication at GHz frequencies is very difficult in fresh waters and even more so in salt waters. [11]
Atmospheric effects
Water vapor is a greenhouse gas in the Earth's atmosphere, responsible for 70% of the known absorption of incoming sunlight, particularly in the infrared region, and about 60% of the atmospheric absorption of thermal radiation by the Earth known as the greenhouse effect.[25] It is also an important factor in multispectral imaging and hyperspectral imaging used in remote sensing[12] because water vapor absorbs radiation differently in different spectral bands. Its effects are also an important consideration in infrared astronomy and radio astronomy in the microwave or millimeter wave bands. The South Pole Telescope was constructed in Antarctica in part because the elevation and low temperatures there mean there is very little water vapor in the atmosphere.[26]
Similarly, carbon dioxide absorption bands occur around 1400, 1600 and 2000 nm,[27] but its presence in the Earth's atmosphere accounts for just 26% of the greenhouse effect.[25] Carbon dioxide gas absorbs energy in some small segments of the thermal infrared spectrum that water vapor misses. This extra absorption within the atmosphere causes the air to warm just a bit more and the warmer the atmosphere the greater its capacity to hold more water vapor. This extra water vapor absorption further enhances the Earth’s greenhouse effect.[28]
In the atmospheric window between approximately 8000 and 14000 nm, in the far-infrared spectrum, carbon dioxide and water absorption is weak.[29] This window allows most of the thermal radiation in this band to be radiated out to space directly from the Earth's surface. This band is also used for remote sensing of the Earth from space, for example with thermal Infrared imaging.
As well as absorbing radiation, water vapour occasionally emits radiation in all directions, according to the Black Body Emission curve for its current temperature overlaid on the water absorption spectrum. Much of this energy will be recaptured by other water molecules, but at higher altitudes, radiation sent towards space is less likely to be recaptured, as there is less water available to recapture radiation of water-specific absorbing wavelengths. By the top of the troposphere, about 12 km above sea level, most water vapor condenses to liquid water or ice as it releases its heat of vapourisation. Once changed state, liquid water and ice fall away to lower altitudes. This will be balanced by incoming water vapour rising via convection currents.
Liquid water and ice emit radiation at a higher rate than water vapour (see graph above). Water at the top of the troposphere, particularly in liquid and solid states, cools as it emits net photons to space. Neighboring gas molecules other than water (e.g. Nitrogen) are cooled by passing their heat kinetically to the water. This is why temperatures at the top of the troposphere (known as the tropopause) are about -50 degrees Celsius.
See also
References
- ↑ John Bertie. "John Bertie's Download Site - Spectra". Retrieved August 8, 2012.
- ↑ Bertie J. E.; Lan Z. (1996). "Infrared Intensities of Liquids XX: The Intensity of the OH Stretching Band of Liquid Water Revisited, and the Best Current Values of the Optical Constants of H2O(l) at 25°C between 15,000 and 1 cm−1". Applied Spectroscopy. 50 (8): 1047–1057. Bibcode:1996ApSpe..50.1047B. doi:10.1366/0003702963905385. Retrieved 2012-08-08.
- ↑ Jonasz, Miroslaw (2006). "Absorption coefficient of water: Data sources (www.tpdsci.com/Tpc/AbsCfOfWaterDat.php, data of Bertie JE and Lan 1996). In:Top. Part. Disp. Sci. (www.tpdsci.com)". ISBN 0-9780628-0-9. External link in
|title=(help); - 1 2 "Spectroscopy of Atmospheric Gases (spectral databases)". V.E. Zuev Institute of Atmospheric Optics SB RAS. Retrieved August 8, 2012.
... various data sources: HITRAN and GEISA spectral databanks, original data obtained by IAO researchers in collaboration with other scientists, H2O spectra simulated by Partridge and Schwenke etc...
- 1 2 3 "The HITRAN Database". Atomic and Molecular Physics Division, Harvard-Smithsonian Center for Astrophysics. Retrieved August 8, 2012.
HITRAN is a compilation of spectroscopic parameters that a variety of computer codes use to predict and simulate the transmission and emission of light in the atmosphere.
- 1 2 3 "Hitran on the Web Information System". Harvard-Smithsonian Center for Astrophysics (CFA), Cambridge, MA, USA; V.E. Zuev Institute of Atmosperic Optics (IAO), Tomsk, Russia. Retrieved August 11, 2012.
- ↑ Aringer B.; Kerschbaum F.; Jørgensen U. G. (2002). "H2O in stellar atmospheres" (PDF). Astronomy and Astrophysics. EDP Sciences. 395: 915–927. Bibcode:2002A&A...395..915A. doi:10.1051/0004-6361:20021313. Retrieved 2012-08-08.
- ↑ Richard Brandt. "Optical constants of ice from the ultraviolet to the microwave. Printable Table to replace tables in Warren 1984". External link in
|title=(help); - ↑ Warren S. G. (1984). "Optical constants of ice from the ultraviolet to the microwave" (PDF). Applied Optics. 23: 1206. Bibcode:1984ApOpt..23.1206W. doi:10.1364/AO.23.001206. Retrieved 2012-08-08.
- ↑ Warren S. G.; Brandt R. E. (2008). "Optical constants of ice from the ultraviolet to the microwave: A revised compilation" (PDF). J. Geophys. Res. 113. Bibcode:2008JGRD..11314220W. doi:10.1029/2007JD009744. Retrieved 2012-08-08.
- 1 2 3 4 Wozniak B.; Dera J. (2007). Atmospheric and Oceanographic Sciences Library (PDF). New York: Springer Science+Business Media. LLC. ISBN 978-0-387-30753-4. Retrieved August 4, 2012.
- 1 2 Gordon, Iouli E.; Laurence S. Rothman; Robert R. Gamache; David Jacquemart; Chris Boone; Peter F. Bernathd; Mark W. Shephard; Jennifer S. Delamere; Shepard A. Clough (2007-06-24). "Current updates of the water-vapor line list in HITRAN: A new Diet for air-broadened half-widths" (pdf). Journal of Quantitative Spectroscopy & Radiative Transfer. Retrieved 2007-11-03.
Water vapor is the principal absorber of longwave radiation in the terrestrial atmosphere and it has a profound effect on the atmospheric energy budget in many spectral regions. The HITRAN database lists more than 64,000 significant transitions of water vapor ranging from the microwave region to the visible, with intensities that cover many orders of magnitude. These transitions are used, or have to be accounted for, in various remote-sensing applications.
- ↑ Banwell, Colin N.; McCash, Elaine M. (1994). Fundamentals of molecular spectroscopy (4th ed.). McGraw-Hill. p. 50. ISBN 0-07-707976-0.
- 1 2 3 Nakamoto, Kazuo (1997). Infrared and Raman spectra of inorganic and coordination compounds (5th ed.). Wiley. p. 170. ISBN 0-47116394-5.
- 1 2 Jacquemoud, S.; Ustin, S.L. (2003). "Application of radiative transfer models to moisture content estimation and burned land mapping" (PDF). Joint European Association of Remote Sensing Laboratories (EARSeL) and GOFC/GOLD-Fire Program, 4th Workshop on Forest Fires, Ghent University, Belgium 5--7 June 2003. Retrieved 2008-10-15.
...in the action spectrum of water the three main peaks near 1400, 1950, and 2500 nm, and two minor ones at 970 and 1200 nm
- 1 2 3 4 5 Pope R. M.; Fry E. S. (1997). "Absorption spectrum (380–700 nm) of pure water. II. Integrating cavity measurements". Applied Optics. Optical Society of America. 36 (33): 8710–8723. Bibcode:1997ApOpt..36.8710P. doi:10.1364/AO.36.008710. Retrieved August 1, 2012.
- ↑ Duarte, F. J., Edited (1995). Tunable Laser Applications. New York: M. Dekker. ISBN 0-8247-8928-8.
There are three sets of water-vapor absorption lines in the near-IR spectral region. Those near 730 and 820 nm are useful for lower tropo- spheric measurements, whereas those near 930 nm are useful for upper- tropospheric measurements...
- ↑ Chaplin, Martin (2007-10-28). "Water Absorption Spectrum". Retrieved 2007-11-04.
In the liquid, rotations tend to be restricted by hydrogen bonds, giving the librations. Also, spectral lines are broader causing overlap of many of the absorption peaks. The main stretching band in liquid water is shifted to a lower frequency and the bending frequency increased by hydrogen bonding.
- ↑ Carter, G.A.; McCain, D.C. (1993). "Relationship of leaf spectral reflectance to chloroplast water content determined using NMR microscopy". Remote Sensing of Environment. 46 (3): 305–310. doi:10.1016/0034-4257(93)90050-8. Retrieved 2007-10-31.
Reflectance responses to leaf water content were greatest in the water absorption bands near 1450 nm, 1950 nm, and 2500 nm wavelengths
- ↑ Rossel, R.A.V.; McBratney, A.B. (1998). "Laboratory evaluation of a proximal sensing technique for simultaneous measurement of soil clay and water content". Geoderma. 85 (1): 19–39. doi:10.1016/S0016-7061(98)00023-8. Retrieved 2007-10-31.
the strong absorption bands of OH groups in soil water at around 1450, 1950 and 2500 nm.
- 1 2 Kou L.; Labrie D.; Chýlek P. (1993). "Refractive indices of water and ice the 0.65- to 2.5-µm spectral range.". Applied Optics. Optical Society of America. 32 (19): 3531–3540. Bibcode:1993ApOpt..32.3531K. doi:10.1364/AO.32.003531. Retrieved August 2, 2012.
- 1 2 Jonasz, Miroslaw (2007). "Absorption coefficient of water: Data sources (www.tpdsci.com/Tpc/AbsCfOfWaterDat.php, data of Pope RM and Fry 1997 and of Kou L et al. 1993). In:Top. Part. Disp. Sci. (www.tpdsci.com)". ISBN 0-9780628-0-9. External link in
|title=(help); - ↑ Chaplin, Martin. "Water and Microwaves". Water Structure and Science.
- ↑ Kaatze, G.A.; Behrends, R.; Pottel, R (2002). "Hydrogen network fluctuations and dielectric spectrometry of liquids" (PDF). J. Non-Cryst. Solids. 305: 19–29. Bibcode:2002JNCS..305...19K. doi:10.1016/S0022-3093(02)01084-0.
- 1 2 Maurellis, Ahilleas (2003-05-01). "The climatic effects of water vapour - physicsworld.com". Physics World. Institute of Physics. Retrieved 2007-11-03.
- ↑ "South Pole Telescope: South Pole : Why is the telescope at the South Pole?". University of Chicago. Retrieved 2007-11-03.
Quick Answer: Because the South Pole is probably the best place on Earth for this telescope. It is extremely dry, making the atmosphere exceptionally transparent for SPT.
- ↑ Prieto-Blanco, Ana; Peter R. J. North; Nigel Fox; Michael J. Barnsley. "Satellite estimation of surface/atmosphere parameters: a sensitivity study" (pdf). Retrieved 2007-10-31.
...water absorption bands (around 940nm, 1100nm, 1450nm, 1950nm and 2500nm) and carbon dioxide absorption bands (1400nm, 1600nm and 2000nm)...
- ↑ "EO Study: Does the Earth have an Iris Analog". NASA. Retrieved 2007-11-04.
- ↑ Cotton, William (2006). Human Impacts on Weather and Climate. Cambridge: Cambridge University Press. ISBN 0-521-84086-4.
Little absorption is evident in the region called the atmospheric window between 8 and 14 μm
External links
| Wikimedia Commons has media related to Electromagnetic absorption by water. |
| Overviews | ||
|---|---|---|
| States | ||
| Forms | ||
| On Earth | ||
| ||