Ethnic demography of Kazakhstan
Kazakhstan is multiethnic country where indigenous ethnic group - the Kazakhs, comprise the majority of the population. According to the 2016 census there are two dominant ethnic groups in Kazakhstan: ethnic Kazakhs (66.48%) and ethnic Russians (20.61%) with a wide array of other groups represented, including Ukrainians, Uzbeks, Germans, Koreans, and Uyghurs.
History
Kazakhstan's dominant ethnic group Kazakhs, traces its origin to 15th century, when number of Turkic and some Mongol tribes united to establish Kazakh Khanate. With cohesive culture and national identity, they constituted absolute majority on the land until Russian colonization.
Russian advancement into the territory of Kazakhstan began in the late 18th century, when the Kazakhs nominally accepted Russian rule in exchange for protection against repeated attacks by the western Mongolian Kalmyks. In the 1890s, Russian peasants began to settle the fertile lands of northern Kazakhstan, causing many Kazakhs to move eastwards into Chinese territory in search of new grazing grounds.
Drastic changes during XX century
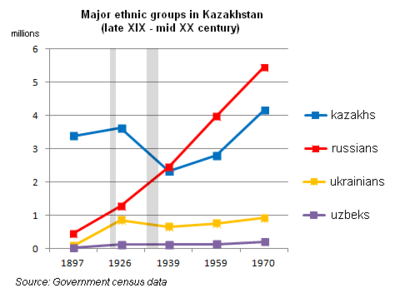
Big factor that greatly shaped the ethnic composition of Kazakhstan were major famines of 1920s and of 1930s, caused by intermittent droughts and aggravated by the actions of the Soviet power. According to different estimates only in famine of 1930s up to 40% of Kazakhs (indigenous ethnic group) either died of starvation or fled the territory.[1] Official government census data report the contraction of Kazakh population from 3.6 million in 1926, to 2.3 million in 1939.
By mid 20th century, Kazakhstan is home to virtually any ethnic group that has ever come under the Russian sphere of influence. This diverse demography stemmed from countries's central location and its historical use by Russia as a place to send colonists, dissidents, and minority groups from its other frontiers. From the 1930s until the 1950s, both Russian opposition (and such Russians "accused" of being part of the opposition) and certain minorities (especially Volga Germans, Poles, Ukrainians, Crimean Tatars, Kalmyks) had been interned in labor camps often merely due to their heritage or beliefs, mostly on collective orders by Joseph Stalin. This makes Kazakhstan one of the few places on Earth where normally-disparate Germanic, Indo-Iranian, Koreans, Chechen, and Turkic groups live together in a rural setting and not as a result of modern immigration.
After the fall of the Soviet Union, the German population of Kazakhstan proceeded to emigrate en masse during the 1990s , as Germany was willing to repatriate them. Also much of the smaller Greek minority took the chance to repatriate to Greece, so did many Russians move to Russia. Some groups have fewer good options for emigration but because of the economic situation are also leaving at rates comparable to the rest of the former East bloc.
Ethnic Composition of Kazakhstan
| Nationality | 1897 - % | 1911 - % | 1926 - % | 1939 - % | 1959 - % | 1970 - % | 1979 - % | 1989 - % | 1999 - % | 2009 - % | 2014 - % |
|---|---|---|---|---|---|---|---|---|---|---|---|
| Kazakh | 73.9 | 60.8 | 59.5 | 38.0 | 30.0 | 32.6 | 36.0 | 39.7 | 53.4 | 63.1 | 65.5 |
| Russian | 12.8 | 27.0 | 18.0 | 40.2 | 42.7 | 42.4 | 40.8 | 37.4 | 29.9 | 23.7 | 21.5 |
| Uzbek | 1.3 | 1.1 | 3.2 | 1.7 | 1.1 | 1.7 | 1.8 | 2.0 | 2.5 | 2.8 | 3.0 |
| Ukrainian | * | * | 12.4 | 10.8 | 8.2 | 7.2 | 6.1 | 5.4 | 3.7 | 2.1 | 1.8 |
| Uyghur | - | - | - | - | 0.6 | 0.9 | 1.0 | 1.1 | 1.4 | 1.4 | 1.4 |
| Tatar | 1.1 | 1.1 | 0.7 | 1.6 | 1.5 | 2.2 | 2.1 | 2.0 | 1.7 | 1.3 | 1.2 |
| German | - | - | 0.7 | 1.5 | 7.1 | 6.6 | 6.1 | 5.8 | 2.4 | 1.1 | 1.1 |
| Korean | - | - | - | - | 0.8 | 0.6 | 0.6 | 0.6 | 0.7 | 0.6 | 0.6 |
| Belarusian | * | * | - | 0.5 | 1.2 | 1.5 | 1.2 | 1.1 | 0.8 | 0.4 | 0.4 |
* For 1897 and 1911 "Russians" includes Ukrainians and Belarusians.
| Ethnic Group | Population |
|---|---|
| Total | 16,009,597 |
| Kazakh | 10,096,763 |
| Russian | 3,793,764 |
| Uzbek | 456,997 |
| Ukrainian | 333,031 |
| Uighur | 224,713 |
| Tatar | 204,229 |
| German | 178,409 |
| Korean | 100,385 |
| Turk | 97,015 |
| Azeri | 85,292 |
| Belarusian | 66,476 |
| Dungan | 51,944 |
| Kurd | 38,325 |
| Tadzhik | 36,277 |
| Polish | 34,057 |
| Chechen | 31,431 |
| Kyrgyz | 23,274 |
| Bashkir | 17,263 |
| Ingush | 15,120 |
| Moldvin | 14,245 |
| Armene | 13,776 |
| Greek | 8,846 |
| Mordvin | 8,013 |
| Chuvash | 7,301 |
| Udmurt | 5,824 |
| Georgian | 4,990 |
| Lithuanian | 4,925 |
| Persian | 4,819 |
| Bulgarian | 4,523 |
| Marij | 4,416 |
| Gipsy | 4,065 |
| Jewish | 3,485 |
| Lezghin | 3,481 |
| Chinese | 3,424 |
| Karalakpak | 2,828 |
| Turkmen | 2,234 |
| Balkar | 1,798 |
| Indo-Pak | 1,783 |
| Crimean Tatar | 1,532 |
| Osset | 1,326 |
| Avar | 1,202 |
| Latvian | 1,123 |
| Karachai | 995 |
| Estonian | 986 |
| Dargin | 790 |
| Afghan | 659 |
| Arab | 618 |
| Permyak | 561 |
| Karelian | 518 |
| Gagauz | 493 |
| Kumyk | 481 |
| Albanian | 459 |
| Khant | 429 |
| Kalmyk | 422 |
| Romanian | 421 |
| American | 411 |
| Lak | 382 |
| Finn | 373 |
| Mongol | 365 |
| Maghiar | 357 |
| Buriot | 346 |
| Nogai | 276 |
| Czech | 271 |
| Udin | 247 |
| Karaim | 231 |
| Kabarda | 226 |
| Khakass | 223 |
| Tabasaran | 222 |
| Altay | 221 |
| Serb | 213 |
| Italian | 209 |
| Assyrian | 195 |
| English | 191 |
| Baloch | 137 |
| Talysh | 132 |
| Koryak | 121 |
| Sakha | 119 |
| Slovak | 115 |
| Cherkess | 111 |
| Croat | 102 |
| Shor | 96 |
| Agul | 94 |
| Tat | 93 |
| Adyghe | 87 |
| Rutul | 82 |
| Abkhaz | 76 |
| French | 73 |
| Austrian | 61 |
| Livv | 49 |
| Dutch | 46 |
| Japanese | 46 |
| Kuban | 45 |
| Spanish | 41 |
| Tyvin | 37 |
| Viet | 35 |
| Krymchak | 35 |
| Vogul | 32 |
| Mountain Jewish | 30 |
| Abaza | 27 |
| Chuvan | 25 |
| Georgian Jewish | 23 |
| Swede | 16 |
| Komi | 15 |
| Nanay | 14 |
| Even | 11 |
| Others | 8 |
| Nenet | 7 |
| Negidal | 6 |
| Bukharan Jewish | 5 |
| Chukchi | 5 |
| Aleut | 4 |
| Gilyak | 4 |
| Dolgan | 3 |
| Oroch | 3 |
| Selkup | 2 |
| Udihe | 2 |
| Tsakhur | 2 |
| Evenk | 2 |
| Veps | 1 |
| Izhor | 1 |
| Ulch | 1 |
| Itelmen | 0 |
| Ket | 0 |
| Rushani | 0 |
| Sami | 0 |
| Tofalar | 0 |
| Ulta | 0 |
| Shughnan | 0 |
| Enets | 0 |
| Yukaghir | 0 |
Census of 1999
Table: Ethnic Composition of Kazakhstan (Detailed Census Data)[6]
| Ethnic groups | 1999 | 1989 | % change, 1989 to 1999 | % Of 1999 Pop | % Of 1989 Pop |
|---|---|---|---|---|---|
| Total population | 14,953,126 | 16,464,464 | -9.18 | 100.00 | 100.00 |
| Kazakhs | 7,985,039 | 6,534,616 | 22.20 | 53.40 | 39.69 |
| Russians | 4,479,618 | 6,227,549 | -28.07 | 29.95 | 37.82 |
| Ukrainians | 547,052 | 896,240 | -38.96 | 3.65 | 5.44 |
| Uzbeks | 370,663 | 332,017 | 11.64 | 2.47 | 2.02 |
| Germans | 353,441 | 957,518 | -63.09 | 2.36 | 5.82 |
| Tatars | 248,952 | 327,982 | -24.10 | 1.66 | 1.99 |
| Uyghurs | 210,339 | 185,301 | 13.51 | 1.40 | 1.13 |
| Belarusians | 111,926 | 182,601 | -38.70 | 0.74 | 1.11 |
| Koreans | 99,657 | 103,315 | -3.54 | 0.66 | 0.63 |
| Azeris | 78,295 | 90,083 | -13.09 | 0.52 | 0.55 |
| Poles | 47,297 | 59,956 | -21.11 | 0.31 | 0.36 |
| Dungans | 36,945 | 30,165 | 22.48 | 0.24 | 0.18 |
| Kurds | 32,764 | 25,425 | 28.87 | 0.21 | 0.15 |
| Chechens | 31,799 | 49,507 | -35.77 | 0.21 | 0.30 |
| Tajiks | 25,657 | 25,514 | 0.56 | 0.17 | 0.15 |
| Bashkirs | 23,224 | 41,847 | -44.50 | 0.15 | 0.25 |
| Moldovans | 19,458 | 33,098 | -41.21 | 0.13 | 0.20 |
| Ingush | 16,893 | 19,914 | -15.17 | 0.11 | 0.12 |
| Mordvins | 16,147 | 30,036 | -46.24 | 0.10 | 0.18 |
| Armenians | 14,758 | 19,119 | -22.81 | 0.09 | 0.12 |
| Greeks | 12,703 | 46,746 | -72.83 | 0.08 | 0.28 |
| Kyrgyz | 10,896 | 14,112 | -22.79 | 0.07 | 0.09 |
| Bulgarians | 6,915 | 10,426 | -33.68 | 0.04 | 0.06 |
| Lezgins | 4,616 | 13,905 | -66.80 | 0.03 | 0.08 |
| Turkmens | 1,729 | 3,846 | -55.04 | 0.01 | 0.02 |
| Other | 166,342 | 203,626 | -18.31 | 1.11 | 1.24 |
| No response | 1 | 119 | -99.16 | 0.00 | 0.00 |
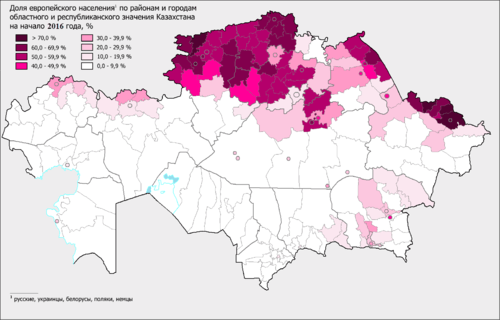
Total Slavic/European population 27.0% in 2009 (compared with 60.3% in 1959, 57.3% in 1970, 54.5% in 1979, 49.8% in 1989 and 39.0% in 1999).[2]
Demographic data
Vital statistics
As explained above, the Slavic groups have been declining ever since the 1960s, due to low birth rates and high death rates. Germans are characterized by very high birth rates, but it is mostly due to the high proportion of rural population and the presence of conservative religious factions like Mennonites and Evangelical Lutherans among them.
Table: Demographic characteristics of various ethnic groups of Kazakhstan[7]
| Ethnic Group | Births | Deaths | Natural Growth | Birth Rate | Death Rate | Natural Growth | ||||||||||||
|---|---|---|---|---|---|---|---|---|---|---|---|---|---|---|---|---|---|---|
| 1999 | 2007 | 2008 | 1999 | 2007 | 2008 | 1999 | 2007 | 2008 | 1999 | 2007 | 2008 | 1999 | 2007 | 2008 | 1999 | 2007 | 2008 | |
| Total | 217,578 | 321,963 | 356,575 | 147,416 | 158,297 | 152,706 | 70,162 | 163,666 | 203,869 | 14.57 | 20.79 | 22.75 | 9.87 | 10.22 | 9.74 | 0.47% | 1.06% | 1.30% |
| Kazakh | 142,363 | 227,002 | 254,402 | 52,337 | 61,639 | 61,397 | 90,026 | 165,363 | 193,005 | 17.77 | 24.73 | 27.06 | 6.62 | 6.82 | 6.63 | 1.12% | 1.79% | 2.04% |
| Russian | 39,215 | 46,667 | 49,134 | 62,130 | 62,151 | 58,586 | -22,915 | -15,484 | -9,452 | 8.84 | 11.94 | 12.68 | 14.28 | 16.30 | 15.35 | -0.54% | -0.44% | -0.27% |
| Uzbek | 9,534 | 13,398 | 15,047 | 2,224 | 2,560 | 2,828 | 7,310 | 10,838 | 12,219 | 25.54 | 30.22 | 33.02 | 6.04 | 5.91 | 6.30 | 1.95% | 2.43% | 2.67% |
| Ukrainian | 5,156 | 4,936 | 5,267 | 11,426 | 11,139 | 10,506 | -6,270 | -6,203 | -5,239 | 9.56 | 11.37 | 12.37 | 21.55 | 26.33 | 25.06 | -1.20% | -1.50% | -1.27% |
| Uighur | 3,529 | 5,424 | 6,054 | 1,187 | 1,433 | 1,495 | 2,342 | 3,991 | 4,559 | 16.72 | 23.19 | 25.34 | 5.70 | 6.12 | 6.35 | 1.10% | 1.71% | 1.90% |
| Tatar | 2,398 | 3,143 | 3,375 | 3,363 | 3,668 | 3,398 | -965 | -525 | -23 | 9.70 | 13.87 | 14.90 | 13.88 | 16.62 | 15.23 | 1.70% | -0.28% | -0.03% |
| German | 4,765 | 4,267 | 4,810 | 3,524 | 2,606 | 2,585 | 1,241 | 1,661 | 2,225 | 13.97 | 19.28 | 21.81 | 10.49 | 12.06 | 11.90 | 0.35% | 0.72% | 0.99% |
| Others | 10,411 | 15,889 | 17,424 | 8,651 | 9,283 | 9,168 | 1,760 | 6,606 | 8,256 | 13.79 | 20.45 | 22.23 | 11.66 | 12.19 | 11.87 | 0.21% | 0.83% | 1.04% |
| Unknown | 207 | 1,237 | 1,062 | 2,574 | 3,818 | 2,743 | -2,367 | -2,581 | -1,681 | NA | NA | NA | NA | NA | NA | NA | NA | NA |
Inter-ethnic marriages
Most of the inter-ethnic marriages in Kazakhstan has been between various Slavic or Germanic groups (Russian - Ukrainian, German - Ukrainian, Russian - Polish or German - Russian). Inter-marriages between Turkic and European ethnic groups are increasing, but still quite rare.
Table: Number of individuals married outside their ethnic group[7]
| Ethnic Group | Males | Females | ||||
|---|---|---|---|---|---|---|
| 1999 | 2007 | 2008 | 1999 | 2007 | 2008 | |
| Total | 18,402 | 26,632 | 24,243 | 18,402 | 26,632 | 24,243 |
| Kazakh | 2,199 | 4,981 | 4,785 | 1,542 | 4,062 | 3,874 |
| Russian | 5,957 | 7,795 | 6,991 | 7,431 | 9,714 | 8,544 |
| Uzbek | 240 | 714 | 657 | 200 | 600 | 537 |
| Ukrainian | 2,717 | 3,070 | 2,555 | 2,541 | 2,858 | 2,466 |
| Uighur | 269 | 658 | 655 | 224 | 530 | 525 |
| Tatar | 948 | 1,682 | 1,425 | 938 | 1,651 | 1,413 |
| German | 2,844 | 2,365 | 2,048 | 3,137 | 2,566 | 2,270 |
| Other | 3,180 | 5,351 | 4,426 | 2,313 | 4,610 | 4,010 |
| Unknown | 48 | 16 | 701 | 76 | 41 | 604 |
Mechanical population movement
Slavic and Germanic groups have been emigrating en masse since the 1960s, and the movement accelerated during the 1990s after the breakup of the Soviet Union. This has resulted in the reduction of the proportion of European ethnic groups in the population by more than half. More than 50% of the European Soviet ethnic groups have left Kazakhstan since 1989, and just 15% of the pre-1989 ethnic German population remains now in the country.
Most of the immigration has been directed towards Russia, but small numbers have been immigrating to Ukraine, Belarus and Armenia also. Before the German authorities stopped the repatriation of ethnic Germans and their non-German relatives, Germany was one of the most favored destination for all the ethnic groups. It is estimated that close to half of the 4.5 million Soviet Germans and their Slavic kin who now live in Germany are originally from Kazakhstan. Currently on average close to 2,000 ethnic Germans emigrate from Kazakhstan to ethnic German dominated areas in Russia such as Azovsky Nemetsky National District (Deutsche Nationalkreis Asowo) in Omsk Oblast and Nemetsky National District (Nationalkreis Halbstadt) in Altai Krai. Also, out of the 1.2 million Russian speaking Jews and Slavs who live in Israel, a significant portion is from Kazakhstan.
On the other hand, ethnic Kazakhs and Uzbeks have been immigrating to large numbers to Kazakhstan ever since the collapse of the USSR. These immigrants come not only from the southern Central Asian states such as Uzbekistan and Tajikistan, but also from the Kazakh dominated areas in Xinjiang and Mongolia. The Kazakh government is actively encouraging the settlement of these compatriots (known as Oralman) in Slavic dominated North and East Kazakhstan as well as the German dominated Karaganda Region, in order to dilute the minority populations there. There is also a low intensity immigration of ethnic Slavs from the less tolerant neighboring nations like Uzbekistan and Turkmenistan into Kazakhstan. An estimated 400,000 Uzbeks have migrated to Kazakhstan in recent years [8]
Table: Data on immigration in Kazakhstan[7]
| Ethnic Group | Kazakhstan | |||||||||
|---|---|---|---|---|---|---|---|---|---|---|
| Immigrants | Emigrants | Net Immigration | ||||||||
| 1999 | 2007 | 2008 | 1999 | 2007 | 2008 | 1999 | 2007 | 2008 | ||
| Total | 41,320 | 53,397 | 46,404 | 164,947 | 42,435 | 45,287 | -123,627 | 10,962 | 1,117 | |
| Kazakh | 10,909 | 41,763 | 35,081 | 8,258 | 2,269 | 2,281 | 2,651 | 39,494 | 32,800 | |
| Russian | 20,076 | 6,658 | 6,268 | 91,489 | 29,492 | 31,631 | -71,413 | -22,834 | -25,363 | |
| Uzbek | 1,028 | 446 | 439 | 962 | 101 | 137 | 66 | 345 | 302 | |
| Ukrainian | 2,526 | 601 | 643 | 15,315 | 3,433 | 3,676 | -12,789 | -2,832 | -3,033 | |
| Uighur | 95 | 84 | 111 | 99 | 40 | 36 | -4 | 44 | 75 | |
| Tatar | 1,129 | 476 | 433 | 3,971 | 995 | 1,034 | -2,842 | -519 | -601 | |
| German | 1,417 | 517 | 525 | 32,921 | 2,991 | 3,146 | -31,504 | -2,474 | -2,621 | |
| Other | 4,140 | 2,852 | 2,904 | 11,932 | 3,114 | 3,346 | -7,792 | -262 | -442 | |
| CIS Nations | ||||||||||
| Immigrants | Emigrants | Net Immigration | ||||||||
| 1999 | 2007 | 2008 | 1999 | 2007 | 2008 | 1999 | 2007 | 2008 | ||
| Total | 39,461 | 42,613 | 31,425 | 120,240 | 39,767 | 42,908 | -80,779 | 2,846 | -11,483 | |
| Kazakh | 19,796 | 32,110 | 21,222 | 7,689 | 2,082 | 2,120 | 2,432 | 30,028 | 19,102 | |
| Russian | 19,796 | 6,308 | 6,033 | 81,020 | 28,657 | 30,775 | -61,224 | -22,349 | -24,742 | |
| Uzbek | 1,020 | 441 | 435 | 921 | 95 | 126 | 99 | 346 | 309 | |
| Ukrainian | 2,488 | 556 | 600 | 13,182 | 3,289 | 3,532 | -10,694 | -2,733 | -2,932 | |
| Uighur | 94 | 73 | 99 | 78 | 29 | 31 | 16 | 44 | 68 | |
| Tatar | 1,124 | 465 | 427 | 3,714 | 981 | 1,002 | -2,590 | -516 | -575 | |
| German | 1,119 | 259 | 253 | 4,164 | 1,874 | 2,250 | -3,045 | -1,615 | -1,997 | |
| Other | 3,699 | 2,401 | 2,356 | 9,472 | 2,760 | 3,072 | -5,773 | -359 | -716 | |
| Non-CIS Nations | ||||||||||
| Immigrants | Emigrants | Net Immigration | ||||||||
| 1999 | 2007 | 2008 | 1999 | 2007 | 2008 | 1999 | 2007 | 2008 | ||
| Total | 1,859 | 10,784 | 14,979 | 44,707 | 2,668 | 2,379 | -42,848 | 8,116 | 12,600 | |
| Kazakh | 788 | 9,653 | 13,859 | 569 | 187 | 161 | 219 | 9,466 | 13,698 | |
| Russian | 280 | 350 | 235 | 10,469 | 835 | 856 | -10,189 | -485 | -621 | |
| Uzbek | 8 | 5 | 4 | 41 | 6 | 11 | -33 | -1 | -7 | |
| Ukrainian | 38 | 45 | 43 | 2,133 | 144 | 144 | -2,095 | -99 | -101 | |
| Uighur | 1 | 11 | 12 | 21 | 11 | 5 | -20 | 0 | 7 | |
| Tatar | 5 | 11 | 6 | 257 | 14 | 32 | -252 | -3 | -26 | |
| German | 298 | 258 | 272 | 28,757 | 1,117 | 896 | -28,459 | -859 | -624 | |
| Other | 441 | 451 | 548 | 2,460 | 354 | 274 | -2,019 | 97 | 274 | |
Religion
According to the 2009 Census data, almost all the Central Asian Turkics are Muslims and Slavs are Orthodox:[9]
| Ethnic Groups | Islam | Christianity | Judaism | Buddhism | Other | Atheism | NA |
|---|---|---|---|---|---|---|---|
| Total | 70.20% | 26.32% | 0.03% | 0.09% | 0.02% | 2.82% | 0.51% |
| Kazakhs | 98.34% | 0.39% | 0.02% | 0.01% | 0.02% | 0.98% | 0.26% |
| Russians | 1.43% | 91.64% | 0.04% | 0.02% | 0.03% | 6.09% | 0.75% |
| Uzbeks | 99.05% | 0.39% | 0.01% | 0.01% | 0.02% | 0.37% | 0.16% |
| Ukrainians | 0.94% | 90.74% | 0.03% | 0.01% | 0.02% | 7.31% | 0.94% |
| Uyghurs | 98.35% | 0.51% | 0.02% | 0.01% | 0.03% | 0.61% | 0.47% |
| Tatars | 79.57% | 10.24% | 0.02% | 0.03% | 0.06% | 8.11% | 1.97% |
| Germans | 1.58% | 81.59% | 0.05% | 0.04% | 0.11% | 13.96% | 2.68% |
| Koreans | 5.24% | 49.35% | 0.21% | 11.40% | 0.14% | 28.51% | 5.16% |
| Turks | 99.13% | 0.30% | 0.01% | 0.01% | 0.02% | 0.33% | 0.21% |
| Azeris | 94.81% | 2.51% | 0.02% | 0.02% | 0.03% | 1.86% | 0.76% |
| Belarusians | 0.79% | 90.16% | 0.04% | 0.01% | 0.03% | 7.82% | 1.15% |
| Dungans | 98.93% | 0.37% | 0.01% | 0.03% | 0.04% | 0.34% | 0.28% |
| Kurds | 98.28% | 0.53% | 0.03% | 0.02% | 0.02% | 0.74% | 0.38% |
| Tajiks | 97.78% | 0.91% | 0.01% | 0.02% | 0.08% | 0.85% | 0.35% |
| Poles | 0.69% | 90.07% | 0.04% | 0.01% | 0.13% | 7.30% | 1.76% |
| Chechens | 93.69% | 2.99% | 0.02% | 0.01% | 0.05% | 2.08% | 1.16% |
| Kirghiz | 96.67% | 0.89% | 0.03% | 0.03% | 0.02% | 1.51% | 0.86% |
| Others | 34.69% | 52.32% | 0.82% | 0.91% | 0.13% | 8.44% | 2.69% |
See also
- Demographics of Central Asia
- Demographics of Kazakhstan
- Assembly of People of Kazakhstan
- Russians in Kazakhstan
- Ukrainians in Kazakhstan
- Germans in Kazakhstan
- Poles in Kazakhstan
- Greeks in Kazakhstan
- Koreans in Kazakhstan
- Uyghurs in Kazakhstan
- Chinese in Kazakhstan
- Turks in Kazakhstan
- Kurds in Kazakhstan
- Armenians in Kazakhstan
- Azerbaijanis in Kazakhstan
- Tatars of Kazakhstan
- Bulgarians in Kazakhstan
References
- ↑ Валерий Михайлов: Во время голода в Казахстане погибло 40 процентов населения
- 1 2 Office of the United Nations High Commissioner for Human Rights: data for 1959-1999 (Internet Archive v. 27 November 2007)
- ↑ Alexandrov, Mikhail. Uneasy Alliance: Relations Between Russia and Kazakhstan in the Post-Soviet Era, 1992-1997. Greenwood Press, 1999, ISBN 978-0-313-30965-6
- ↑ Demographic situation in the Republic of Kazakhstan in 2006, Agency on Statistics of the Republic of Kazakhstan (Internet Archive v. 11 October 2007) (Russian)
- ↑ "Archived copy". Archived from the original on June 28, 2010. Retrieved June 1, 2010.
- ↑ Ethnodemographic situation in Kazakhstan on ide.go.jp (unidentified source)
- 1 2 3 "Archived copy" (PDF). Archived from the original (PDF) on July 5, 2010. Retrieved March 23, 2010.
- ↑ Central Asian Immigration: Steppe Change The Economist. 22 March 2007
- ↑ "Archived copy". Archived from the original on May 11, 2011. Retrieved July 24, 2011.