Demographics of Turkmenistan
The Demographics of Turkmenistan is about the demographic features of the population of Turkmenistan, including population growth, population density, ethnicity, education level, health, economic status, religious affiliations, and other aspects of the population. The ethnic majority in Turkmenistan call themselves Turkmen.
Demographic trends
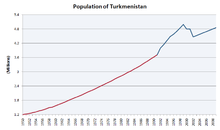
The population of Turkmenistan increased from 1.5 million in the 1959 census to 4.5 million in the 1995 census.[1] The population continued growing to over 5 million in 2001-2006.[2]
Vital statistics
UN estimates
| Period | Live births per year | Deaths per year | Natural change per year | CBR1 | CDR1 | NC1 | TFR1 | IMR1 |
|---|---|---|---|---|---|---|---|---|
| 1950-1955 | 55 000 | 21 000 | 35 000 | 43.2 | 16.2 | 27.0 | 6.00 | 150.0 |
| 1955-1960 | 64 000 | 23 000 | 41 000 | 43.3 | 15.5 | 27.8 | 6.02 | 140.1 |
| 1960-1965 | 78 000 | 24 000 | 53 000 | 44.6 | 13.9 | 30.7 | 6.75 | 130.3 |
| 1965-1970 | 77 000 | 24 000 | 54 000 | 38.0 | 11.7 | 26.3 | 6.34 | 120.4 |
| 1970-1975 | 87 000 | 24 000 | 63 000 | 37.1 | 10.3 | 26.8 | 6.19 | 110.6 |
| 1975-1980 | 95 000 | 26 000 | 69 000 | 35.3 | 9.6 | 25.8 | 5.32 | 100.7 |
| 1980-1985 | 107 000 | 27 000 | 81 000 | 35.2 | 8.7 | 26.5 | 4.79 | 90.9 |
| 1985-1990 | 123 000 | 28 000 | 95 000 | 35.7 | 8.2 | 27.4 | 4.55 | 81.0 |
| 1990-1995 | 128 000 | 34 000 | 94 000 | 32.9 | 8.6 | 24.3 | 4.03 | 75.5 |
| 1995-2000 | 106 000 | 34 000 | 73 000 | 25.0 | 7.8 | 17.2 | 3.03 | 61.3 |
| 2000-2005 | 108 000 | 36 000 | 72 000 | 23.3 | 7.7 | 15.6 | 2.76 | 51.7 |
| 2005-2010 | 108 000 | 38 000 | 70 000 | 22.1 | 7.8 | 14.3 | 2.50 | 50.5 |
| 2010-2015 | 21.5 | 7.8 | 13.7 | 2.34 | ||||
| 2015-2020 | 20.0 | 7.8 | 12.2 | 2.22 | ||||
| 1 CBR = crude birth rate (per 1000); CDR = crude death rate (per 1000); NC = natural change (per 1000); TFR = total fertility rate (number of children per woman); IMR = infant mortality rate per 1000 births | ||||||||
Registered births and deaths
| Average population (x 1000) | Live births | Deaths | Natural change | Crude birth rate (per 1000) | Crude death rate (per 1000) | Natural change (per 1000) | |
|---|---|---|---|---|---|---|---|
| 1950 | 1 211 | 46 335 | 12 411 | 33 924 | 38.3 | 10.2 | 28.0 |
| 1951 | 1 234 | 46 417 | 12 707 | 33 710 | 37.6 | 10.3 | 27.3 |
| 1952 | 1 260 | 49 306 | 14 775 | 34 531 | 39.1 | 11.7 | 27.4 |
| 1953 | 1 290 | 48 482 | 15 567 | 32 915 | 37.6 | 12.1 | 25.5 |
| 1954 | 1 321 | 51 162 | 14 650 | 36 512 | 38.7 | 11.1 | 27.6 |
| 1955 | 1 356 | 55 171 | 14 075 | 41 096 | 40.7 | 10.4 | 30.3 |
| 1956 | 1 390 | 53 528 | 11 783 | 41 745 | 38.5 | 8.5 | 30.0 |
| 1957 | 1 434 | 55 955 | 10 940 | 45 015 | 39.0 | 7.6 | 31.4 |
| 1958 | 1 487 | 59 235 | 10 987 | 48 248 | 39.8 | 7.4 | 32.4 |
| 1959 | 1 539 | 60 430 | 10 594 | 49 836 | 39.3 | 6.9 | 32.4 |
| 1960 | 1 593 | 67 676 | 10 433 | 57 243 | 42.5 | 6.5 | 35.9 |
| 1961 | 1 653 | 67 790 | 10 841 | 56 949 | 41.0 | 6.6 | 34.5 |
| 1962 | 1 713 | 68 725 | 11 772 | 56 953 | 40.1 | 6.9 | 33.2 |
| 1963 | 1 773 | 70 005 | 11 098 | 58 907 | 39.5 | 6.3 | 33.2 |
| 1964 | 1 833 | 69 777 | 11 623 | 58 154 | 38.1 | 6.3 | 31.8 |
| 1965 | 1 890 | 70 258 | 13 152 | 57 106 | 37.2 | 7.0 | 30.2 |
| 1966 | 1 943 | 73 109 | 13 036 | 60 073 | 37.6 | 6.7 | 30.9 |
| 1967 | 2 001 | 71 062 | 14 043 | 57 019 | 35.5 | 7.0 | 28.5 |
| 1968 | 2 061 | 73 470 | 14 223 | 59 247 | 35.6 | 6.9 | 28.7 |
| 1969 | 2 124 | 72 892 | 14 754 | 58 138 | 34.3 | 6.9 | 27.4 |
| 1970 | 2 188 | 77 080 | 14 370 | 62 710 | 35.2 | 6.6 | 28.6 |
| 1971 | 2 251 | 78 357 | 15 031 | 63 326 | 34.8 | 6.7 | 28.1 |
| 1972 | 2 315 | 78 841 | 16 680 | 62 161 | 34.0 | 7.2 | 26.8 |
| 1973 | 2 380 | 82 111 | 17 336 | 64 775 | 34.5 | 7.3 | 27.2 |
| 1974 | 2 449 | 84 607 | 17 766 | 66 841 | 34.5 | 7.2 | 27.3 |
| 1975 | 2 520 | 87 369 | 19 876 | 67 493 | 34.7 | 7.9 | 26.8 |
| 1976 | 2 588 | 90 765 | 20 040 | 70 725 | 35.1 | 7.7 | 27.4 |
| 1977 | 2 655 | 91 826 | 20 801 | 71 025 | 34.6 | 7.8 | 26.8 |
| 1978 | 2 724 | 93 798 | 21 847 | 71 951 | 34.4 | 8.0 | 26.4 |
| 1979 | 2 792 | 97 511 | 21 583 | 75 928 | 34.9 | 7.7 | 27.2 |
| 1980 | 2 861 | 98 069 | 23 863 | 74 206 | 34.3 | 8.3 | 25.9 |
| 1981 | 2 931 | 100 627 | 24 883 | 75 744 | 34.3 | 8.5 | 25.8 |
| 1982 | 3 003 | 104 340 | 23 984 | 80 356 | 34.7 | 8.0 | 26.8 |
| 1983 | 3 076 | 108 171 | 26 015 | 82 156 | 35.2 | 8.5 | 26.7 |
| 1984 | 3 151 | 111 083 | 25 760 | 85 323 | 35.3 | 8.2 | 27.1 |
| 1985 | 3 229 | 116 285 | 26 080 | 90 205 | 36.0 | 8.1 | 27.9 |
| 1986 | 3 310 | 122 337 | 27 865 | 94 472 | 37.0 | 8.4 | 28.5 |
| 1987 | 3 393 | 126 787 | 26 802 | 99 985 | 37.4 | 7.9 | 29.5 |
| 1988 | 3 479 | 125 887 | 27 317 | 98 570 | 36.2 | 7.9 | 28.3 |
| 1989 | 3 571 | 124 992 | 27 609 | 97 383 | 35.0 | 7.7 | 27.3 |
| 1990 | 3 668 | 125 343 | 25 755 | 99 588 | 34.2 | 7.0 | 27.2 |
| 1991 | 3 772 | 126 248 | 27 403 | 98 845 | 33.5 | 7.3 | 26.2 |
| 1992 | 3 883 | 131 034 | 27 509 | 103 525 | 33.7 | 7.1 | 26.7 |
| 1993 | 3 993 | 130 708 | 31 171 | 99 537 | 32.7 | 7.8 | 24.9 |
| 1994 | 4 096 | 129 700 | 32 067 | 97 633 | 31.7 | 7.8 | 23.8 |
| 1995 | 130 200 | ||||||
| 1996 | 125 400 | ||||||
| 1997 | 126 200 | ||||||
| 1998 | 121 900 | ||||||
| 1999 | 120 100 | ||||||
| 2000 | 119 665 | ||||||
| 2001 | 115 400 | ||||||
| 2002 | 111 039 | ||||||
| 2003 | 111 900 | ||||||
| 2004 | 115 119 | ||||||
| 2005 | 116 209 | ||||||
| 2006 | 116 542 | ||||||
| 2007 | 103 700 | ||||||
| 2008 | 114 900 | ||||||
| 2009 | 129 900 | ||||||
| 2010 | 144 600 |
Fertility and Births
Total Fertility Rate (TFR) (Wanted Fertility Rate) and Crude Birth Rate (CBR):[6]
| Year | CBR (Total) | TFR (Total) | CBR (Urban) | TFR (Urban) | CBR (Rural) | TFR (Rural) |
|---|---|---|---|---|---|---|
| 2000 | 24,6 | 2,89 (2,66) | 20,5 | 2,46 (2,29) | 28,2 | 3,30 (3,00) |
Ethnic groups
The table shows the ethnic composition of Turkmenistan's population (in percent) between 1926 and 1995.[1] There has been a sharp decline in the Slavic ethnic groups (Russians and Ukrainians) and also Kazakhs and Tatars since independence (as captured in the 1979 and 1995 censuses). Uzbeks are now the second largest ethnic group in Turkmenistan, with Russians relegated to the third place. According to data announced in Ashgabat in February 2001, 91% of the population are Turkmen, 3% are Uzbeks, and 2% are Russians. Between 1989 and 2001 the number of Turkmen in Turkmenistan doubled (from 2.5 to 4.9 million), while the number of Russians dropped by two-thirds (from 334,000 to slightly over 100,000).[7] However, this rapid growth seems rather unlikely.
| Ethnic group |
census 19261 | census 19392 | census 19593 | census 19704 | census 19795 | census 19896 | census 19957 | census 20128 | ||||||||
|---|---|---|---|---|---|---|---|---|---|---|---|---|---|---|---|---|
| Number | % | Number | % | Number | % | Number | % | Number | % | Number | % | Number | % | Number | % | |
| Turkmens | 719,792 | 71.9 | 741,488 | 59.2 | 923,724 | 60.9 | 1,416,700 | 65.6 | 1,891,695 | 68.4 | 2,536,606 | 72.0 | 3,403,639 | 76.7 | 4,066,959 | 85.6 |
| Uzbeks | 104,971 | 10.5 | 107,451 | 8.6 | 125,231 | 8.3 | 179,498 | 8.3 | 233,730 | 8.5 | 317,333 | 9.0 | 408,259 | 9.2 | 275,565 | 5.8 |
| Russians | 75,357 | 7.5 | 232,924 | 18.6 | 262,701 | 17.3 | 313,079 | 14.5 | 349,170 | 12.6 | 333,892 | 9.5 | 297,319 | 6.7 | 242,307 | 5.1 |
| Kazakhs | 9,471 | 0.9 | 61,397 | 4.9 | 69,522 | 4.6 | 68,519 | 3.2 | 79,539 | 2.9 | 87,802 | 2.5 | 88,752 | 2.0 | 19,004 | 0.4 |
| Azerbaijanis | 4,229 | 0.4 | 7,442 | 0.6 | 12,868 | 0.8 | 16,775 | 0.8 | 23,548 | 0.9 | 33,365 | 0.9 | 36,586 | 0.8 | ||
| Balochi | 9,974 | 1.0 | 5,396 | 0.4 | 7,626 | 0.5 | 12,374 | 0.6 | 18,584 | 0.7 | 28,280 | 0.8 | 36,428 | 0.8 | ||
| Tatars | 4,769 | 0.5 | 19,517 | 1.6 | 29,946 | 2.0 | 36,457 | 1.7 | 40,432 | 1.5 | 39,277 | 1.1 | 35,501 | 0.8 | ||
| Armenians | 13,859 | 1.4 | 15,996 | 1.3 | 19,696 | 1.3 | 23,054 | 1.1 | 26,605 | 1.0 | 31,829 | 0.9 | 33,638 | 0.8 | ||
| Ukrainians | 6,877 | 0.7 | 21,778 | 1.7 | 20,955 | 1.4 | 35,398 | 1.6 | 37,118 | 1.3 | 35,578 | 1.0 | 23,064 | 0.5 | ||
| Others | 51,615 | 5.2 | 38,494 | 3.1 | 44,106 | 2.9 | 57,026 | 2.6 | 64,327 | 2.3 | 78,755 | 2.2 | 71,168 | 1.7 | 142,285 | 3.1 |
| Total | 1,000,914 | 1,251,883 | 1,516,375 | 2,158,880 | 2,764,848 | 3,522,717 | 4,434,354 | 4,751,120 | ||||||||
| 1 Source: . 2 Source: . 3 Source: . 4 Source: . 5 Source: . 6 Source: . 6 Source: 7 Source: | ||||||||||||||||
CIA World Factbook demographic statistics
The following demographic statistics are from the CIA World Factbook as of September 2009, unless otherwise indicated.[8]
Language
Religion
- Islam 89%
- Eastern Orthodox 9%
- Unknown 2%
Ethnic groups
Age structure
- 0-14 years: 28.9% (male 713,698/female 697,222)
- 15-64 years: 66.9% (male 1,618,678/female 1,646,992)
- 65 years and over: 4.3% (male 90,352/female 117,945) (2009 est.)
Sex ratio
- at birth:1.05 male(s)/female
- under 15 years:1.02 male(s)/female
- 15-64 years: 0.98 male(s)/female
- 65 years and over:0.77 male(s)/female
- total population: 0.98 male(s)/female (2009 est.)
Life expectancy at birth
- total population:67.87 years
- male:64.94 years
- female:70.95 years (2009 est.)
Nationality
- noun:Turkmen(s)
- adjective:Turkmen
Literacy
- definition:age 15 and over can read and write
- total population:98.8%
- male: 99.3%
- female: 98.3% (1999 est.)
See also
References
- 1 2 Population census of Turkmenistan 1995, Vol. 1, State Statistical Committee of Turkmenistan, Ashgabat, 1996.
- ↑ "Demoscope Weekly - Annex. Information-analytical system. 4 step". Demoscope.ru. Retrieved 2016-02-14.
- ↑ "The 2015 Revision of World Population Prospects". Esa.un.org. Retrieved 2016-02-14.
- ↑ "United Nations Statistics Division - Demographic and Social Statistics". Unstats.un.org. Retrieved 2016-02-14.
- ↑ Естественное движение населения республик СССР, 1935 [Natural population growth of the Republics of the USSR, 1935] (in Russian). Demoscope.ru. Retrieved 31 March 2015.
- ↑ "Turkmenistan : 2000 Demographic and Health Survey" (PDF). Dhsprogram.com. Retrieved 2016-02-14.
- ↑ Ethnic composition of Turkmenistan in 2001, Demoscope Weekly, No. 37-38, 8–21 October 2001.
- ↑ "Central Asia :: TURKMENISTAN". CIA The World Factbook.