Demographics of Kazakhstan
| Demographics of Kazakhstan | |
|---|---|
|
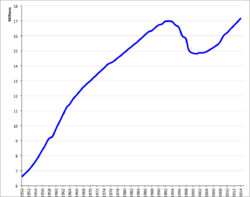
Population of Kazakhstan (in millions) from 1950–2009. | |
| Population | 17,165,239 (Jan, 2013) |
| Density | 5.94/km2 |
| Growth rate | 13.5/1,000 population (2010 est.) |
| Birth rate | 22.4 births/1,000 population (2010 est.) |
| Death rate | 8.9 deaths/1,000 population (2010 est.) |
| Life expectancy | 67.87 years |
| • male | 62.58 years |
| • female | 73.47 years (2009 est.) |
| Fertility rate | 2.65 children born/woman (2010 est.) |
| Infant mortality rate | 18.4 deaths/1,000 live births |
| Age structure | |
| 0–14 years | 21.8% (male 1,717,469/female 1,643,920) |
| 15–64 years | 70.2% (male 5,279,292/female 5,534,607) |
| 65 and over | 7.9% (male 426,494/female 797,655) (2009 est.) |
| Sex ratio | |
| At birth | 0.94 male(s)/female |
| Under 15 | 1.04 male(s)/female |
| 15–64 years | 0.95 male(s)/female |
| 65 and over | 0.54 male(s)/female |
| Nationality | |
| Nationality | Kazakh(s), Kazakhstani |
| Major ethnic | Kazakh |
| Minor ethnic | Russian, Uzbek, Ukrainian, Uyghur, Tatar, German |
| Language | |
| Official | Kazakh |
| Spoken | Kazakh, Russian |
The demographics of Kazakhstan enumerate the demographic features of the population of Kazakhstan, including population growth, population density, ethnicity, education level, health, economic status, religious affiliations, and other aspects of the population. Some use the word Kazakh to refer to the Kazakh ethnic group and language (autochthonous to Kazakhstan as well as parts of Russia, China and Mongolia) and Kazakhstani to refer to Kazakhstan and its citizens regardless of ethnicity,[1][2] but it is not uncommon to use Kazakh in both senses.[3][4][5]
Demographic trends
Official estimates put the population of Kazakhstan at 16,500,000 as of April 2011, of which 46% is rural and 54% urban population.[6] The 2009 population estimate is 6.8% higher than the population reported in the last census from January 1999 (slightly less than 15 million). These estimates have been confirmed by the 2009 population census, and this means that the decline in population that began after 1989 has been arrested and reversed.
The proportion of men makes up 48.3%, the proportion of women 51.7%. The proportion of Kazakhs makes up 63.6%, Russians 23.7%, Uzbeks 2.9%, Ukrainians 2.1%, Uygur 1.4%, Tatars 1.3%, Germans 1.1%, others 3.9%.
The population of Kazakhstan increased steadily from 6.1 million in the 1939 census to 16.5 million in the 1989 census. Official estimates indicate that the population continued to increase after 1989, peaking out at 17 million in 1993 and then declining to 15 million in the 1999 census. The downward trend continued through 2002, when the estimated population bottomed out at 14.9 million, and then resumed its growth.[7] Significant amounts of Russians returned to Russia. Kazakhstan underwent significant urbanization during the first 50 years of the Soviet era, as the share of rural population declined from more than 90% in the 1920s to less than 50% since the 1970s.[8]
Population of Kazakhstan 1939–2014
| Year (January) | Population ('000) | Rural, % | Urban, % | Source |
|---|---|---|---|---|
| 1939 | 6,081 | 72 | 28 | census |
| 1959 | 9,295 | 56 | 44 | census |
| 1970 | 13,001 | 50 | 50 | census |
| 1979 | 14,685 | 46 | 54 | census |
| 1989 | 16,537 | 43 | 57 | census |
| 1999 | 14,953 | 43 | 57 | census |
| 2002 | 14,851 | 43 | 57 | estimate |
| 2005 | 15,075 | 43 | 57 | estimate |
| 2008 | 15,572 | 47 | 53 | estimate |
| 2009 | 15,982 | 46 | 54 | census |
| 2010 | 16,203 | 46 | 54 | estimate |
| 2011 | 16,440 | 45 | 55 | estimate |
| 2012 | 16,673 | 45 | 55 | estimate |
| 2013 | 16,909 | 45 | 55 | estimate |
| 2014 | 17,160 | 45 | 55 | estimate |
- Data sources: Population 1939-1999 from demoscope.ru,[7] 2002-2008 from Kazakhstan Statistical Agency web site.[9] Rural/urban shares 1939-1993 from statistical yearbooks, print editions,[8] 2002-2008 from Kazakhstan Statistical Agency web site.[9] 2009-2014 from Kazakhstan Statistical Agency web site.[10]
As of 2003, there were discrepancies between Western sources regarding the population of Kazakhstan. United States government sources, including the CIA World Fact Book and the US Census Bureau International Data Base, listed the population as 15,340,533,[11] while the World Bank gave a 2002 estimate of 14,794,830. This discrepancy was presumably due to difficulties in measurement caused by the large migratory population in Kazakhstan, emigration, and low population density - only about 5.5 persons per km² in an area the size of Western Europe.
Vital statistics
Births and deaths
| Average population (x 1000) | Live births1 | Deaths1 | Natural change1 | Crude birth rate (per 1000) | Crude death rate (per 1000) | Natural change (per 1000) | Fertility rates | |
|---|---|---|---|---|---|---|---|---|
| 1950 | 6 703 | 254 169 | 79 005 | 175 164 | 37.9 | 11.8 | 26.1 | |
| 1951 | 6 946 | 272 354 | 80 553 | 191 801 | 39.2 | 11.6 | 27.6 | |
| 1952 | 7 133 | 265 235 | 85 241 | 179 994 | 37.2 | 12.0 | 25.2 | |
| 1953 | 7 271 | 262 758 | 73 930 | 188 828 | 36.1 | 10.2 | 26.0 | |
| 1954 | 7 528 | 278 420 | 76 092 | 202 328 | 37.0 | 10.1 | 26.9 | |
| 1955 | 7 992 | 299 854 | 73 283 | 226 571 | 37.5 | 9.2 | 28.3 | |
| 1956 | 8 426 | 305 430 | 64 807 | 240 623 | 36.3 | 7.7 | 28.6 | |
| 1957 | 8 722 | 326 766 | 68 050 | 258 716 | 37.5 | 7.8 | 29.7 | |
| 1958 | 9 077 | 336 020 | 62 680 | 273 340 | 37.0 | 6.9 | 30.1 | |
| 1959 | 9 516 | 349 794 | 69 602 | 280 192 | 36.8 | 7.3 | 29.4 | |
| 1960 | 9 996 | 372 595 | 65 667 | 306 928 | 37.2 | 6.6 | 30.7 | |
| 1961 | 10 480 | 377 789 | 68 610 | 309 179 | 36.1 | 6.5 | 29.5 | |
| 1962 | 10 958 | 369 002 | 70 952 | 298 050 | 33.7 | 6.5 | 27.2 | |
| 1963 | 11 321 | 346 084 | 67 218 | 278 866 | 30.6 | 5.9 | 24.6 | |
| 1964 | 11 610 | 324 412 | 66 197 | 258 215 | 27.9 | 5.7 | 22.2 | |
| 1965 | 11 909 | 314 533 | 69 803 | 244 730 | 26.4 | 5.9 | 20.6 | |
| 1966 | 12 185 | 307 905 | 69 402 | 238 503 | 25.3 | 5.7 | 19.6 | |
| 1967 | 12 456 | 301 715 | 71 824 | 229 891 | 24.2 | 5.8 | 18.5 | |
| 1968 | 12 694 | 296 882 | 73 496 | 223 386 | 23.4 | 5.8 | 17.6 | |
| 1969 | 12 901 | 297 129 | 78 660 | 218 469 | 23.0 | 6.1 | 16.9 | |
| 1970 | 13 106 | 301 451 | 77 619 | 223 832 | 23.0 | 5.9 | 17.1 | |
| 1971 | 13 321 | 317 423 | 79 881 | 237 542 | 23.8 | 6.0 | 17.8 | |
| 1972 | 13 534 | 318 551 | 85 122 | 233 429 | 23.5 | 6.3 | 17.2 | |
| 1973 | 13 742 | 321 075 | 90 282 | 230 793 | 23.4 | 6.6 | 16.8 | |
| 1974 | 13 955 | 338 291 | 93 582 | 244 709 | 24.2 | 6.7 | 17.5 | |
| 1975 | 14 136 | 343 668 | 101 865 | 241 803 | 24.3 | 7.2 | 17.1 | |
| 1976 | 14 279 | 350 362 | 103 892 | 246 470 | 24.5 | 7.3 | 17.3 | |
| 1977 | 14 425 | 349 379 | 105 376 | 244 003 | 24.2 | 7.3 | 16.9 | |
| 1978 | 14 589 | 355 337 | 107 293 | 248 044 | 24.4 | 7.4 | 17.0 | |
| 1979 | 14 743 | 354 320 | 113 687 | 240 633 | 24.0 | 7.7 | 16.3 | |
| 1980 | 14 884 | 356 013 | 119 078 | 236 935 | 23.9 | 8.0 | 15.9 | |
| 1981 | 15 033 | 367 950 | 120 974 | 246 976 | 24.5 | 8.0 | 16.4 | |
| 1982 | 15 185 | 373 416 | 120 165 | 253 251 | 24.6 | 7.9 | 16.7 | |
| 1983 | 15 334 | 378 577 | 123 807 | 254 770 | 24.7 | 8.1 | 16.6 | |
| 1984 | 15 481 | 399 403 | 129 796 | 269 607 | 25.8 | 8.4 | 17.4 | |
| 1985 | 15 623 | 396 929 | 126 786 | 270 143 | 25.4 | 8.1 | 17.3 | |
| 1986 | 15 776 | 410 846 | 119 149 | 291 697 | 26.0 | 7.6 | 18.5 | |
| 1987 | 15 948 | 417 139 | 122 835 | 294 304 | 26.2 | 7.7 | 18.5 | |
| 1988 | 16 188 | 407 116 | 126 898 | 280 218 | 25.3 | 7.9 | 17.4 | |
| 1989 | 16 243 | 382 269 | 126 378 | 255 891 | 23.5 | 7.8 | 15.8 | |
| 1990 | 16 328 | 362 081 | 128 576 | 233 505 | 22.2 | 7.9 | 14.3 | |
| 1991 | 16 405 | 353 174 | 134 324 | 218 850 | 21.5 | 8.2 | 13.3 | 2.67 |
| 1992 | 16 439 | 337 612 | 137 518 | 200 094 | 20.5 | 8.4 | 12.2 | 2.62 |
| 1993 | 16 381 | 315 482 | 156 070 | 159 412 | 19.3 | 9.5 | 9.7 | 2.54 |
| 1994 | 16 146 | 305 624 | 160 339 | 145 285 | 18.9 | 9.9 | 9.0 | 2.43 |
| 1995 | 15 816 | 276 125 | 168 656 | 107 469 | 17.5 | 10.7 | 6.8 | 2.21 |
| 1996 | 15 578 | 253 175 | 166 028 | 87 147 | 16.3 | 10.7 | 5.6 | 2.02 |
| 1997 | 15 334 | 232 356 | 160 138 | 72 218 | 15.2 | 10.4 | 4.7 | 1.93 |
| 1998 | 15 072 | 222 380 | 154 314 | 68 066 | 14.8 | 10.2 | 4.5 | 1.81 |
| 1999 | 14 939 | 217 578 | 147 416 | 70 162 | 14.6 | 9.9 | 4.7 | 1.79 |
| 2000 | 14 915 | 222 054 | 149 778 | 72 276 | 14.9 | 10.0 | 4.8 | 1.88 |
| 2001 | 14 910 | 221 487 | 147 876 | 73 611 | 14.9 | 9.9 | 4.9 | 1.84 |
| 2002 | 14 931 | 227 171 | 149 381 | 77 790 | 15.2 | 10.0 | 5.2 | 1.88 |
| 2003 | 15 002 | 247 946 | 155 277 | 92 669 | 16.5 | 10.4 | 6.2 | 2.03 |
| 2004 | 15 126 | 273 028 | 152 250 | 120 778 | 18.0 | 10.1 | 8.0 | 2.21 |
| 2005 | 15 281 | 278 977 | 157 121 | 121 856 | 18.3 | 10.3 | 8.0 | 2.22 |
| 2006 | 15 463 | 301 756 | 157 210 | 144 546 | 19.5 | 10.2 | 9.3 | 2.36 |
| 2007 | 15 659 | 321 963 | 158 297 | 163 666 | 20.6 | 10.1 | 10.5 | 2.47 |
| 2008 | 15 870 | 356 575 | 152 706 | 203 869 | 22.5 | 9.6 | 12.8 | 2.68 |
| 2009 | 16 093 | 356 378 | 143 238 | 213 140 | 22.1 | 8.9 | 13.2 | 2.55 |
| 2010 | 16 322 | 367 942 | 146 370 | 221 572 | 22.5 | 8.9 | 13.6 | 2.60 |
| 2011 | 16 557 | 372 801 | 144 944 | 227 857 | 22.5 | 8.7 | 13.8 | 2.59 |
| 2012 | 16 791 | 381 005 | 142 880 | 238 125 | 22.7 | 8.5 | 14.2 | 2.62 |
| 2013 | 17 035 | 393 421 | 137 630 | 255 791 | 22.7 | 8.0 | 14.7 | 2.64 |
| 2014 | 17 289 | 401 066 | 132 236 | 268 830 | 23.1[15] | 7.6 | 15.5 | 2.76 |
| 2015 | 17 557 | 398 561 | 131 867 | 266 694 | 22.7 | 7.5 | 15.2 | 2.73 |
1 Births and deaths until 1979 are estimates.
Structure of the population [16]
Structure of the population (01.07.2008) (Estimates) :
| Age Group | Male | Female | Total | % |
|---|---|---|---|---|
| Total | 7 541 053 | 8 132 947 | 15 674 000 | 100 |
| 0-4 | 748 150 | 709 793 | 1 457 943 | 9.30 |
| 5-9 | 564 701 | 537 847 | 1 102 548 | 7.03 |
| 10-14 | 617 314 | 592 199 | 1 209 513 | 7.72 |
| 15-19 | 755 608 | 730 830 | 1 486 438 | 9.48 |
| 20-24 | 784 675 | 765 803 | 1 550 478 | 9.89 |
| 25-29 | 651 820 | 644 059 | 1 295 879 | 8.27 |
| 30-34 | 580 262 | 596 220 | 1 176 482 | 7.51 |
| 35-39 | 533 348 | 559 349 | 1 092 697 | 6.97 |
| 40-44 | 501 603 | 543 293 | 1 044 896 | 6.67 |
| 45-49 | 515 147 | 580 290 | 1 095 437 | 6.99 |
| 50-54 | 404 797 | 482 577 | 887 374 | 5.66 |
| 55-59 | 306 307 | 394 131 | 700 438 | 4.47 |
| 60-64 | 160 524 | 222 349 | 382 873 | 2.44 |
| 65-69 | 168 503 | 271 744 | 440 247 | 2.81 |
| 70-74 | 131 480 | 222 294 | 33 774 | 2.26 |
| 75-79 | 68 446 | 140 506 | 208 952 | 1.33 |
| 80-84 | 36 112 | 98 418 | 134 530 | 0.86 |
| 85-89 | 9 112 | 30 681 | 39 793 | 0.25 |
| 90-94 | 2 091 | 8 213 | 10 304 | 0.07 |
| 95-99 | 731 | 1 947 | 2 678 | 0.02 |
| 100+ | 322 | 404 | 726 | <0.01 |
| Age group | Male | Female | Total | Percent |
|---|---|---|---|---|
| 0-14 | 1 930 165 | 1 839 839 | 3 770 004 | 24.05 |
| 15-64 | 5 194 091 | 5 518 901 | 10 712 992 | 68.35 |
| 65+ | 416 797 | 774 207 | 1 191 004 | 7.60 |
Total fertility rate
Total fertility rate by regions of Kazakhstan: Mangystau - 3.80, South Kazakhstan - 3.71, Kyzylorda - 3.42, Atyrau - 3.29, Jambyl - 3.20, Aqtobe - 2.70, Almaty (province) - 2.65, Almaty (city) - 2.65, City of Astana - 2.44, West Kazakhstan - 2.29, Aqmola - 2.19, East Kazakhstan - 2.07, Qaragandy - 2.04, Pavlodar - 1.98, North Kazakhstan - 1.72, Qostanay - 1.70, Republic of Kazakhstan - 2.65. Thus it can be seen that fertility rate is higher in more traditionalist and religious south and west, and lower in the north and east, where the percentage of Slavic and German population is still relatively high.[17][18][19]
According to the Kazakhstan Demographic and Health Survey in 1999, the TFR for Kazakhs was 2.5 and that for Russians was 1.38. TFR in 1989 for Kazakhs & Russians were 3.58 and 2.24 respectively.[20]
Ethnic groups
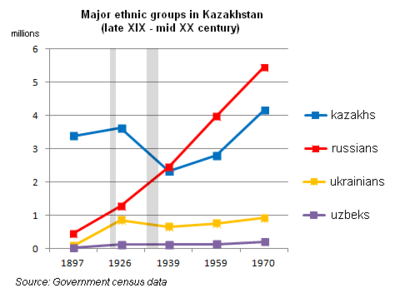
History of ethnic composition
Kazakhstan's dominant ethnic group Kazakhs, traces its origin to 15th century, when number of Turkic and some Mongol tribes united to establish Kazakh Khanate. With cohesive culture and national identity, they constituted absolute majority on the land until Russian colonization.
Russian advancement into the territory of Kazakhstan began in the late 18th century, when the Kazakhs nominally accepted Russian rule in exchange for protection against repeated attacks by the western Mongolian Kalmyks. In the 1890s, Russian peasants began to settle the fertile lands of northern Kazakhstan, causing many Kazakhs to move eastwards into Chinese territory in search of new grazing grounds. The 1906 completion of the Trans-Aral Railway between Orenburg and Tashkent further facilitated Russian colonization.[22][23] The first collectivized farms opened in Kazakhstan in 1921, populated primarily by Russians and Soviet deportees. In 1930, as part of the first Five Year Plan, the Kazakh Central Committee decreed the sedentarization of nomads and their incorporation into collectivized farms. This movement resulted in devastating famine, claiming the lives of an estimated 40% of ethnic Kazakhs (1.5 million), between 1930-33.[24] Hundreds of thousands also fled to China, Iran and Afghanistan. The famine rendered Kazakhs a minority within Kazakhstan, and only after the republic gained independence in 1991 did Kazakhs recover a slim demographic majority within Kazakhstan.[22]
Demographics would continue to shift in the 1950-1960s, wherein as part of Nikita Kruschev's Virgin Lands Campaign, hundreds of thousands of Soviet deportees were relocated to the Kazakh steppes in order to farm. As recognized in the 1959 census, the Kazaks became a minority in for the first time in history, composing just 30% of the total population of Kazakhstan. Russians numbered 42.7%.[25]
According to the 2009 census, the ethnic composition of Kazakhstan is approximately: 63.1% Kazakh, 23.7% Russian, 2.9% Uzbek, 2.1% Ukrainian, 1.4% Uyghur, 1.3% Tatar, 1.1% German, 1% Kyrgyz, and <1% Korean, Turkish, Azerbaijani, Belarusian, Dungan, Kurd, Tajik, Pole, Chechen.[26]
| Ethnic group |
census 18971 | census 19262 | census 19393 | census 19594 | census 19705 | census 19796 | census 19897 | census 19998 | ||||||||
|---|---|---|---|---|---|---|---|---|---|---|---|---|---|---|---|---|
| Number | % | Number | % | Number | % | Number | % | Number | % | Number | % | Number | % | Number | % | |
| Kazakhs | 3,392,751 | 73.9 | 3,627,612 | 58.5 | 2,327,625 | 37.8 | 2,794,966 | 30.0 | 4,161,164 | 32.4 | 5,289,349 | 36.0 | 6,534,616 | 39.7 | 8,011,452 | 53.5 |
| Russians | 454,402 | 12.8 | 1,275,055 | 20.6 | 2,458,687 | 40.0 | 3,974,229 | 42.7 | 5,499,826 | 42.8 | 5,991,205 | 40.8 | 6,227,549 | 37.8 | 4,480,675 | 29.9 |
| Uzbeks | 29,564 | 1.3 | 129,407 | 2.1 | 120,655 | 2.0 | 136,570 | 1.5 | 207,514 | 1.6 | 263,295 | 1.8 | 332,017 | 2.0 | 370,765 | 2.5 |
| Ukrainians | 860,201 | 13.9 | 860,201 | 13.9 | 658,319 | 10.7 | 762,131 | 8.2 | 930,158 | 7.2 | 897,964 | 6.1 | 896,240 | 5.4 | 547,065 | 3.7 |
| Uygurs | 11,631 | 0.2 | 35,409 | 0.6 | 59,840 | 0.6 | 120,784 | 0.9 | 147,943 | 1.0 | 185,301 | 1.1 | 210,377 | 1.4 | ||
| Tatars | 55,984 | 1.1 | 79,758 | 1.3 | 108,127 | 1.8 | 191,802 | 2.1 | 281,849 | 2.2 | 312,626 | 2.1 | 327,982 | 2.0 | 249,052 | 1.7 |
| Germans | 51,094 | 0.8 | 92,571 | 1.5 | 659,800 | 7.1 | 839,649 | 6.5 | 900,207 | 6.1 | 957,518 | 5.8 | 353,462 | 2.4 | ||
| Koreans | 42 | 0.0 | 96,453 | 1.6 | 74,019 | 0.8 | 78,078 | 0.6 | 91,984 | 0.6 | 103,315 | 0.6 | 99,944 | 0.7 | ||
| Turks | 46 | 0.0 | 523 | 0.0 | 9,916 | 0.1 | 18,397 | 0.1 | 25,820 | 0.2 | 49,567 | 0.3 | 75,950 | 0.5 | ||
| Azerbaijanis | 20 | 0.0 | 12,996 | 0.2 | 38,362 | 0.4 | 56,166 | 0.4 | 73,345 | 0.5 | 90,083 | 0.5 | 78,325 | 0.5 | ||
| Belarusians | 25,584 | 0.4 | 31,614 | 0.5 | 107,463 | 1.2 | 197,592 | 1.5 | 181,491 | 1.2 | 182,601 | 1.1 | 111,924 | 0.7 | ||
| Dungans | 8,455 | 0.1 | 7,415 | 0.1 | 9,980 | 0.1 | 17,283 | 0.1 | 22,491 | 0.2 | 30,165 | 0.2 | 36,945 | 0.2 | ||
| Kurds | 2,387 | 0.0 | 6,109 | 0.1 | 12,299 | 0.1 | 17,692 | 0.1 | 25,425 | 0.2 | 32,764 | 0.2 | ||||
| Tajiks | 7,599 | 0.1 | 11,229 | 0.2 | 8,075 | 0.1 | 7,166 | 0.1 | 19,293 | 0.1 | 25,514 | 0.2 | 25,673 | 0.2 | ||
| Poles | 3,742 | 0.1 | 54,809 | 0.9 | 53,102 | 0.6 | 61,355 | 0.5 | 61,136 | 0.4 | 59,956 | 0.4 | 47,302 | 0.3 | ||
| Chechens | 3 | 0.0 | 2,639 | 0.0 | 130,232 | 1.4 | 34,492 | 0.3 | 38,256 | 0.3 | 49,507 | 0.3 | 31,802 | 0.2 | ||
| Kyrgyz | 10,200 | 0.2 | 5,033 | 0.1 | 6,810 | 0.1 | 9,474 | 0.1 | 9,352 | 0.1 | 14,112 | 0.1 | 10,925 | 0.1 | ||
| Others | 108,016 | 1.7 | 124,611 | 2.0 | 286,441 | 3.1 | 315,347 | 2.5 | 340,834 | 2.3 | 372,996 | 2.3 | 206,879 | 1.4 | ||
| Total | 6,198,465 | 6,151,102 | 9,309,847 | 12,848,573 | 14,684,283 | 16,464,464 | 14,981,281 | |||||||||
| 1 Excluding the Kara-Kalpak AO; source:.[27] 2 Source:.[28] 3 Source:.[29] 4 Source:.[30] 5 Source:.[31] 6 Source:.[32] 7 Source:[33] | ||||||||||||||||
| Ethnic group |
census 20098 | 20149 | ||
|---|---|---|---|---|
| Number | % | Number | % | |
| Kazakhs | 10,096,763 | 63.1 | 11,244,547 | 65.5 |
| Russians | 3,793,764 | 23.7 | 3,685,009 | 21.5 |
| Uzbeks | 456,997 | 2.9 | 521,252 | 3.0 |
| Ukrainians | 333,031 | 2.1 | 301,346 | 1.8 |
| Uygurs | 224,713 | 1.4 | 246,777 | 1.4 |
| Tatars | 204,229 | 1.3 | 203,108 | 1.2 |
| Germans | 178,409 | 1.1 | 181,928 | 1.1 |
| Koreans | 100,385 | 0.6 | 105,400 | 0.6 |
| Turks | 97,015 | 0.6 | 104,792 | 0.6 |
| Azerbaijanis | 85,292 | 0.5 | 98,646 | 0.6 |
| Dungans | 51,944 | 0.3 | 62,029 | 0.4 |
| Belarusians | 66,476 | 0.4 | 60,295 | 0.4 |
| Kurds | 38,325 | 0.2 | 42,312 | 0.3 |
| Tajiks | 36,277 | 0.2 | 42,143 | 0.3 |
| Poles | 34,057 | 0.2 | 32,661 | 0.2 |
| Chechens | 31,431 | 0.2 | 32,252 | 0.2 |
| Kyrgyz | 23,274 | 0.2 | 29,803 | 0.2 |
| Others | 157,215 | 1.0 | ||
| Total | 16,009,597 | 17,160,774 | ||
| 8 Source: 9 Source:[34] | ||||
Religions
References
- ↑ Schreiber, Dagmar and Tredinnick, Jeremy. Kazakhstan. Odyssey Publications, 2010, p. 82.
- ↑ "Kazakhstan". U.S. Department of State. Retrieved 18 March 2015.
- ↑ UK Foreign and Commonwealth Office, Kazakhstan, 2 Feb 2011.
- ↑ "News & featured articles". Retrieved 18 March 2015.
- ↑ Ambassador Erlan A Idissov, Embassy of the Republic of Kazakhstan to the USA.
- ↑ , Statistical Agency of the Republic of Kazakhstan (Russian)
- 1 2 Population dynamics and ethnic composition of Kazakhstan in the second half of the 20th century, Demoscope Weekly, No. 103-104, 3–16 March 2003 (Russian)
- 1 2 Statistical Yearbook of Kazakhstan, Almaty, various years since 1980 (Russian)
- 1 2 Population and social policy, Statistical Agency of the Republic of Kazakhstan (Russian)
- ↑ Statistical Agency of the Republic of Kazakhstan (Russian)
- ↑ CIA Factbook (Kazakhstan) Retrieved on May 2, 2008
- ↑ http://unstats.un.org/unsd/demographic/products/dyb/dyb2.htm#2001 United nations. Demographic Yearbooks
- ↑ "Халық". Retrieved 18 March 2015.
- ↑ Естественное движение населения республик СССР, 1935 [Natural population growth of the Republics of the USSR, 1935] (in Russian). Demoscope.ru. Retrieved 31 March 2015.
- ↑ file:///E:/Demography/%D0%9F%D1%80%D0%B5%D0%B4%D0%B2%D0%B0%D1%80%D0%B8%D1%82%D0%B5%D0%BB%D1%8C%D0%BD%D1%8B%D0%B5%20%D0%B4%D0%B0%D0%BD%D0%BD%D1%8B%D0%B5%202014.pdf
- ↑ http://unstats.un.org/unsd/demographic/products/dyb/dyb2.htm
- ↑
- ↑ Spoorenberg, Thomas (2013). "Fertility changes in Central Asia since 1980". Asian Population Studies. 9 (1): 50–77. doi:10.1080/17441730.2012.752238.
- ↑ Spoorenberg, Thomas (2015). "Explaining recent fertility increase in Central Asia". Asian Population Studies. Routledge. doi:10.1080/17441730.2015.1027275.
- ↑ Kazakhstan: Demographic and Health Survey, 1999 - Final Report, Chapter 4: Fertility
- 1 2 "Central Asia:: KAZAKHSTAN". CIA The World Factbook.
- 1 2 Olcott, M. B. (1995). The Kazakhs. Stanford, California: Stanford University Press.
- ↑ Pierce, A. R. (1960) Russian Central Asia, 1867-1917: A study in colonial rule. Berkeley: University of California Press.
- ↑ Pianciola, N. (2001). The collectivization famine in Kazakhstan, 1931–1933. Harvard Ukrainian Studies, 25(3/4), 237–251. Retrieved from http://www.jstor.org/stable/41036834
- ↑ Zardykhan, Z. (2004). Russians in Kazakhstan and demographic change: Imperial legacy and the Kazakh way of nation building. Asian Ethnicity, 5(1), 61–79.
- ↑ Central Intelligence Agency. (2014). Kazakhstan. In The World Factbook 2013-14. Retrieved from https://www.cia.gov/library/publications/the-world-factbook/geos/kz.html
- ↑ "Äåìîñêîï Weekly - Ïðèëîæåíèå. Ñïðàâî÷íèê ñòàòèñòè÷åñêèõ ïîêàçàòåëåé.". Retrieved 18 March 2015.
- ↑ "Äåìîñêîï Weekly - Ïðèëîæåíèå. Ñïðàâî÷íèê ñòàòèñòè÷åñêèõ ïîêàçàòåëåé.". Retrieved 18 March 2015.
- ↑ "Äåìîñêîï Weekly - Ïðèëîæåíèå. Ñïðàâî÷íèê ñòàòèñòè÷åñêèõ ïîêàçàòåëåé.". Retrieved 18 March 2015.
- ↑ "Äåìîñêîï Weekly - Ïðèëîæåíèå. Ñïðàâî÷íèê ñòàòèñòè÷åñêèõ ïîêàçàòåëåé.". Retrieved 18 March 2015.
- ↑ "Äåìîñêîï Weekly - Ïðèëîæåíèå. Ñïðàâî÷íèê ñòàòèñòè÷åñêèõ ïîêàçàòåëåé.". Retrieved 18 March 2015.
- ↑ "Äåìîñêîï Weekly - Ïðèëîæåíèå. Ñïðàâî÷íèê ñòàòèñòè÷åñêèõ ïîêàçàòåëåé.". Retrieved 18 March 2015.
- ↑ http://www.stat.kz/p_perepis/Documents/Перепись%20рус.pdf
- ↑
Bibliography
- Rasuly-Paleczek, Gabriele; Katschnig, Julia (2005), Central Asia on Display: Proceedings of the VIIth Conference of the European Society for Central Asian Studies, LIT Verlag Münster, ISBN 3-8258-8309-4.
External links
For current data, use these sites.
- Population and social policy, Statistical Agency of the Republic of Kazakhstan (kaz
- World Bank Database
- CIA World Fact Book page on Kazakhstan
- US Census Bureau International Data Base
- countrystudies.us
- WESP population statistics
- Russians left behind in Central Asia
Kazakhstan articles | |||||||||||||||||
|---|---|---|---|---|---|---|---|---|---|---|---|---|---|---|---|---|---|
| History |
|  | |||||||||||||||
| Geography |
| ||||||||||||||||
| Politics | |||||||||||||||||
| Economy | |||||||||||||||||
| Culture |
| ||||||||||||||||
| |||||||||||||||||