Hingham, Montana
| Hingham, Montana | |
|---|---|
| Town | |
 | |
 Location of Hingham, Montana | |
| Coordinates: 48°33′20″N 110°25′23″W / 48.55556°N 110.42306°WCoordinates: 48°33′20″N 110°25′23″W / 48.55556°N 110.42306°W | |
| Country | United States |
| State | Montana |
| County | Hill |
| Area[1] | |
| • Total | 0.17 sq mi (0.44 km2) |
| • Land | 0.17 sq mi (0.44 km2) |
| • Water | 0 sq mi (0 km2) |
| Elevation | 3,031 ft (924 m) |
| Population (2010)[2] | |
| • Total | 118 |
| • Estimate (2015)[3] | 123 |
| • Density | 694.1/sq mi (268.0/km2) |
| Time zone | Mountain (MST) (UTC-7) |
| • Summer (DST) | MDT (UTC-6) |
| ZIP code | 59528 |
| Area code(s) | 406 |
| FIPS code | 30-36400 |
| GNIS feature ID | 0772428 |
Hingham is a town in Hill County, Montana, United States. The population was 118 at the 2010 census.
Geography
Hingham is located at 48°33′20″N 110°25′23″W / 48.55556°N 110.42306°W (48.555641, -110.422951).[4]
According to the United States Census Bureau, the town has a total area of 0.17 square miles (0.44 km2), all of it land.[1]
History of "The Town on the Square"
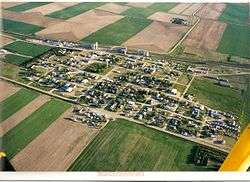
Hingham is a small agricultural community in northern Montana. Hingham, like many Hi-Line towns, developed as a grain storage and shipping center along the Great Northern Railway (BNSF Railway) and U.S. Highway 2. In 1909 homesteaders purchased a relinquishment for the town site, and by early 1910 they had a town established. The community was planned on a broad grid with a central town square as its dominant feature.[5] Hingham prospered in its early years with the opening of a school, hospital, several churches and over forty businesses. In 1917 Hingham incorporated with an elected mayor/council style government.
Community members have developed the town square into one of the best parks on the Hi-Line, much of it through volunteer work and donations. A popular landmark of the town is the water tower which can be seen for miles. The Hingham School was established in 1910 with the Rangers as their mascot and red, white and black as their colors. The school operated until the early 1980s when it consolidated with the neighboring Rudyard School to form Blue Sky Schools. Once again in 2005 Blue Sky Schools consolidated with KG Schools (Kremlin-Gildford) to form North Star Schools. In recent decades Hingham's population has declined due to lack of economic opportunity. In 2010 Hingham celebrated its Centennial.[5] Hingham shares its name with towns in Wisconsin, Massachusetts and Norfolk, England.
Demographics
| Historical population | |||
|---|---|---|---|
| Census | Pop. | %± | |
| 1920 | 154 | — | |
| 1930 | 251 | 63.0% | |
| 1940 | 205 | −18.3% | |
| 1950 | 214 | 4.4% | |
| 1960 | 254 | 18.7% | |
| 1970 | 262 | 3.1% | |
| 1980 | 186 | −29.0% | |
| 1990 | 181 | −2.7% | |
| 2000 | 157 | −13.3% | |
| 2010 | 118 | −24.8% | |
| Est. 2015 | 123 | [6] | 4.2% |
2015 Estimate[3] | |||
2010 census
As of the census[2] of 2010, there were 118 people, 60 households, and 33 families residing in the town. The population density was 694.1 inhabitants per square mile (268.0/km2). There were 83 housing units at an average density of 488.2 per square mile (188.5/km2). The racial makeup of the town was 91.5% White, 3.4% Native American, 0.8% Asian, and 4.2% from two or more races. Hispanic or Latino of any race were 0.8% of the population.
There were 60 households of which 13.3% had children under the age of 18 living with them, 50.0% were married couples living together, 3.3% had a female householder with no husband present, 1.7% had a male householder with no wife present, and 45.0% were non-families. 40.0% of all households were made up of individuals and 21.7% had someone living alone who was 65 years of age or older. The average household size was 1.97 and the average family size was 2.58.
The median age in the town was 52 years. 13.6% of residents were under the age of 18; 4.2% were between the ages of 18 and 24; 12.7% were from 25 to 44; 49.2% were from 45 to 64; and 20.3% were 65 years of age or older. The gender makeup of the town was 52.5% male and 47.5% female.
2000 census
As of the census[9] of 2000, there were 157 people, 65 households, and 38 families residing in the town. The population density was 930.0 people per square mile (356.6/km²). There were 87 housing units at an average density of 515.4 per square mile (197.6/km²). The racial makeup of the town was 96.82% White, 1.91% Native American, and 1.27% from two or more races.
There were 65 households out of which 32.3% had children under the age of 18 living with them, 55.4% were married couples living together, 1.5% had a female householder with no husband present, and 41.5% were non-families. 32.3% of all households were made up of individuals and 20.0% had someone living alone who was 65 years of age or older. The average household size was 2.42 and the average family size was 3.21.
In the town the population was spread out with 27.4% under the age of 18, 5.1% from 18 to 24, 30.6% from 25 to 44, 18.5% from 45 to 64, and 18.5% who were 65 years of age or older. The median age was 41 years. For every 100 females there were 96.3 males. For every 100 females age 18 and over, there were 96.6 males.
The median income for a household in the town was $38,333, and the median income for a family was $45,417. Males had a median income of $32,000 versus $20,625 for females. The per capita income for the town was $16,525. About 9.1% of families and 10.8% of the population were below the poverty line, including 16.4% of those under the age of eighteen and none of those sixty five or over.
Climate
Hingham experiences a semi-arid climate (Köppen BSk) with long, cold, dry winters and hot summers.[10]
| Climate data for Havre | |||||||||||||
|---|---|---|---|---|---|---|---|---|---|---|---|---|---|
| Month | Jan | Feb | Mar | Apr | May | Jun | Jul | Aug | Sep | Oct | Nov | Dec | Year |
| Record high °F (°C) | 68 (20) |
87 (31) |
79 (26) |
95 (35) |
98 (37) |
108 (42) |
108 (42) |
111 (44) |
101 (38) |
91 (33) |
78 (26) |
71 (22) |
111 (44) |
| Average high °F (°C) | 25.5 (−3.6) |
33.4 (0.8) |
44.9 (7.2) |
58.5 (14.7) |
68.8 (20.4) |
77.4 (25.2) |
84.6 (29.2) |
83.9 (28.8) |
71.9 (22.2) |
59.4 (15.2) |
40.8 (4.9) |
30.1 (−1.1) |
56.6 (13.66) |
| Daily mean °F (°C) | 14.6 (−9.7) |
21.9 (−5.6) |
32.5 (0.3) |
44.3 (6.8) |
54.5 (12.5) |
62.7 (17.1) |
68.3 (20.2) |
67.6 (19.8) |
56.3 (13.5) |
44.6 (7) |
29.1 (−1.6) |
19.0 (−7.2) |
42.95 (6.09) |
| Average low °F (°C) | 3.7 (−15.7) |
10.4 (−12) |
20.0 (−6.7) |
30.0 (−1.1) |
40.2 (4.6) |
48.0 (8.9) |
52.0 (11.1) |
51.3 (10.7) |
40.7 (4.8) |
29.8 (−1.2) |
17.3 (−8.2) |
7.8 (−13.4) |
29.27 (−1.52) |
| Record low °F (°C) | −57 (−49) |
−55 (−48) |
−41 (−41) |
−14 (−26) |
9 (−13) |
29 (−2) |
31 (−1) |
27 (−3) |
18 (−8) |
−21 (−29) |
−33 (−36) |
−50 (−46) |
−57 (−49) |
| Average precipitation inches (mm) | 0.47 (11.9) |
0.36 (9.1) |
0.70 (17.8) |
0.87 (22.1) |
1.84 (46.7) |
1.90 (48.3) |
1.51 (38.4) |
1.20 (30.5) |
1.03 (26.2) |
0.62 (15.7) |
0.45 (11.4) |
0.51 (13) |
11.46 (291.1) |
| Source #1: NOAA (normals, 1971–2000) [11] | |||||||||||||
| Source #2: The Weather Channel (Records) [12] | |||||||||||||
References
- 1 2 "US Gazetteer files 2010". United States Census Bureau. Archived from the original on January 24, 2012. Retrieved 2012-12-18.
- 1 2 "American FactFinder". United States Census Bureau. Retrieved 2012-12-18.
- 1 2 "Population Estimates". United States Census Bureau. Retrieved July 14, 2016.
- ↑ "US Gazetteer files: 2010, 2000, and 1990". United States Census Bureau. 2011-02-12. Retrieved 2011-04-23.
- 1 2 Inbody, Kristen (2010-07-10). "Hingham: 'Town on the Square' hits 100". Great Falls Tribune. Retrieved 2014-02-25.
- ↑ "Annual Estimates of the Resident Population for Incorporated Places: April 1, 2010 to July 1, 2015". Retrieved July 2, 2016.
- ↑ "Census of Population and Housing". Census.gov. Archived from the original on May 11, 2015. Retrieved June 4, 2015.
- ↑ "Census & Economic Information Center". Retrieved July 3, 2015.
- ↑ "American FactFinder". United States Census Bureau. Retrieved 2008-01-31.
- ↑ Climate Summary for Hingham, Montana
- ↑ "Climatography of the United States NO.81" (PDF). National Oceanic and Atmospheric Administration. Retrieved January 15, 2011.
- ↑ "Monthly Averages for HIngham, MT". The Weather Channel. Retrieved January 15, 2011.
Municipalities and communities of Hill County, Montana, United States | ||
|---|---|---|
| City | 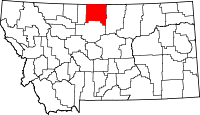 | |
| Town | ||
| CDPs | ||
| Unincorporated communities | ||
| Indian reservation | ||
| Footnotes | ‡This populated place also has portions in an adjacent county or counties | |