Demographics of Cambodia
| Demographics of Cambodia | |
|---|---|
| Population |
|
| Growth rate |
|
| Birth rate |
24.4 births/1,000 population (2014 est.) |
| Death rate |
7.78 deaths/1,000 population (2014 est.) |
| Life expectancy | 69.50 years (2010) [1] |
| • male | 66.80 years |
| • female | 72.10 years |
| Fertility rate |
2.66 children born/woman (2014 est.) |
| Infant mortality rate |
51.36 deaths/1,000 live births (2014 est.) |
| Net migration rate |
|
| Age structure | |
| 0–14 years | 31.9% |
| 15–64 years | 64.3% |
| 65 and over | 3.8% |
| Sex ratio | |
| Total | 0.94 male(s)/female (2013) |
| At birth | 1.05 male(s)/female |
| 65 and over | 0.6 male(s)/female |
| Nationality | |
| Nationality |
noun: Cambodian(s) adjective: Cambodian |
| Major ethnic | Khmer |
| Minor ethnic |
Chinese, Vietnamese, Cham, Thai, Lao |
| Language | |
| Official | Khmer |
This article is about the demographic features of the population of Cambodia, including population density, ethnicity, education level, health of the populace, economic status, religious affiliations and other aspects of the population.
Population
| Historical populations | ||
|---|---|---|
| Year | Pop. | ±% |
| 1876 | 890,000 | — |
| 1901 | 1,103,000 | +23.9% |
| 1911 | 1,487,900 | +34.9% |
| 1921 | 2,402,600 | +61.5% |
| 1931 | 2,806,000 | +16.8% |
| 1947 | 3,296,000 | +17.5% |
| 1951 | 4,261,000 | +29.3% |
| 1961 | 5,510,000 | +29.3% |
| 1971 | 7,270,000 | +31.9% |
| 1981 | 6,682,000 | −8.1% |
| 1991 | 8,810,000 | +31.8% |
| 2001 | 12,353,000 | +40.2% |
| 2011 | 14,701,717 | +19.0% |
| Source:https://www.cia.gov/library/publications/the-world-factbook/geos/cb.html | ||
Between 1874 and 1921, the total population of Cambodia increased from about 946,000 to 2.4 million. By 1950, it had increased to between 3,710,107 and 4,073,967, and in 1962 it had reached 5.7 million. From the 1960s until 1975, the population of Cambodia increased by about 2.2% yearly, the lowest increase in Southeast Asia. By 1975 when the Khmer Rouge took power, it was estimated at 7.3 million. Of this total an estimated one to two million reportedly died between 1975 and 1978. In 1981, the PRK gave the official population figure as nearly 6.7 million, although approximately 6.3 million to 6.4 million is probably more accurate. The average annual rate of population growth from 1978 to 1985 was 2.3% (see table 2, Appendix A). A post-Khmer Rouge baby boom pushed the population above 10 million, although growth has slowed in recent years.
In 1959, about 45% of the population was under 15 years of age. By 1962, this had increased slightly to 46%. In 1962, an estimated 52% of the population was between 15 and 64 years of age, while 2% were older than 65. The percentage of males and females in the three groups was almost the same.
Population and age distribution [2]

| Total population (thousands) | Population aged 0–14 (%) | Population aged 15–64 (%) | Population aged 65+ (%) | |
|---|---|---|---|---|
| 1950 | 4 346 | 42.2 | 55.1 | 2.7 |
| 1955 | 4 840 | 42.3 | 55.0 | 2.7 |
| 1960 | 5 433 | 42.5 | 54.8 | 2.7 |
| 1965 | 6 141 | 42.8 | 54.4 | 2.7 |
| 1970 | 6 938 | 43.2 | 54.0 | 2.8 |
| 1975 | 7 098 | 42.3 | 54.9 | 2.8 |
| 1980 | 6 506 | 39.0 | 58.1 | 2.9 |
| 1985 | 7 920 | 42.1 | 55.0 | 2.9 |
| 1990 | 9 532 | 43.8 | 53.4 | 2.8 |
| 1995 | 11 169 | 47.5 | 49.7 | 2.8 |
| 2000 | 12 447 | 41.6 | 55.4 | 3.0 |
| 2005 | 13 358 | 36.4 | 60.3 | 3.3 |
| 2010 | 14 138 | 31.9 | 64.3 | 3.8 |
Structure of the population [3]
Structure of the population (01.07.2013) (Estimates) (Excluding foreign diplomatic personnel and their dependants. Data based on the 2008 Population Census) :
| Age Group | Male | Female | Total | % |
|---|---|---|---|---|
| Total | 7 320 112 | 7 642 479 | 14 962 591 | 100 |
| 0-4 | 806 531 | 777 854 | 1 584 385 | 10,59 |
| 5-9 | 721 480 | 693 339 | 1 414 819 | 9,46 |
| 10-14 | 768 899 | 735 963 | 1 504 862 | 10,06 |
| 15-19 | 878 612 | 830 980 | 1 709 592 | 11,43 |
| 20-24 | 848 931 | 800 737 | 1 649 668 | 11,03 |
| 25-29 | 678 825 | 712 044 | 1 390 869 | 9,30 |
| 30-34 | 613 674 | 637 973 | 1 251 647 | 8,37 |
| 35-39 | 338 735 | 363 397 | 702 132 | 4,69 |
| 40-44 | 411 072 | 441 415 | 852 487 | 5,70 |
| 45-49 | 344 372 | 395 214 | 739 586 | 4,94 |
| 50-54 | 295 645 | 352 214 | 648 347 | 4,33 |
| 55-59 | 190 528 | 288 806 | 479 334 | 3,20 |
| 60-64 | 153 721 | 218 867 | 372 588 | 2,49 |
| 65-69 | 105 605 | 147 502 | 253 107 | 1,69 |
| 70-74 | 76 017 | 108 069 | 184 086 | 1,23 |
| 75-79 | 47 601 | 72 558 | 120 159 | 0,80 |
| 80+ | 39 864 | 65 059 | 104 923 | 0,70 |
| Age group | Male | Female | Total | Percent |
|---|---|---|---|---|
| 0-14 | 2 296 910 | 2 207 156 | 4 504 066 | 30,10 |
| 15-64 | 4 754 115 | 5 042 135 | 9 796 250 | 65,47 |
| 65+ | 269 087 | 393 188 | 662 275 | 4,43 |
Vital statistics
UN estimates [2]
| Period | Live births per year | Deaths per year | Natural change per year | CBR1 | CDR1 | NC1 | TFR1 | IMR1 |
|---|---|---|---|---|---|---|---|---|
| 1950-1955 | 208 000 | 109 000 | 99 000 | 45.4 | 23.8 | 21.6 | 6.29 | 165.1 |
| 1955-1960 | 232 000 | 113 000 | 119 000 | 45.2 | 22.1 | 23.1 | 6.29 | 152.0 |
| 1960-1965 | 260 000 | 118 000 | 142 000 | 44.9 | 20.4 | 24.5 | 6.29 | 139.5 |
| 1965-1970 | 287 000 | 127 000 | 160 000 | 43.9 | 19.4 | 24.5 | 6.22 | 130.0 |
| 1970-1975 | 280 000 | 158 000 | 122 000 | 39.9 | 22.5 | 17.4 | 5.54 | 180.9 |
| 1975-1980 | 227 000 | 272 000 | - 45 000 | 33.4 | 40.0 | -6.6 | 4.70 | 263.2 |
| 1980-1985 | 410 000 | 127 000 | 283 000 | 56.9 | 17.7 | 39.2 | 7.00 | 134.0 |
| 1985-1990 | 407 000 | 115 000 | 292 000 | 46.7 | 13.2 | 33.5 | 6.00 | 97.9 |
| 1990-1995 | 417 000 | 121 000 | 296 000 | 40.3 | 11.3 | 29.0 | 5.44 | 90.0 |
| 1995-2000 | 358 000 | 121 000 | 237 000 | 30.3 | 10.2 | 20.1 | 4.32 | 83.3 |
| 2000-2005 | 323 000 | 117 000 | 206 000 | 25.1 | 9.1 | 16.0 | 3.41 | 72.9 |
| 2005-2010 | 321 000 | 113 000 | 207 000 | 23.3 | 8.3 | 15.0 | 2.80 | 62.4 |
| 1 CBR = crude birth rate (per 1000); CDR = crude death rate (per 1000); NC = natural change (per 1000); TFR = total fertility rate (number of children per woman); IMR = infant mortality rate per 1000 births | ||||||||
Births and deaths [4]
| Year | Population (x1000) | Live births | Deaths | Natural increase | Crude birth rate | Crude death rate | Rate of natural increase | TFR |
|---|---|---|---|---|---|---|---|---|
| 2004 | 384 267 | 124 391 | 259 876 | |||||
Fertility
The total fertility rate in Cambodia was 3.0 children per woman in 2010.[5] The fertility rate was 4.0 children in 2000.[5] Women in urban areas have 2.2 children on average, compared with 3.3 children per woman in rural areas.[5] Fertility is highest in Mondol Kiri and Rattanak Kiri Provinces, where women have an average of 4.5 children, and lowest in Phnom Penh where women have an average of 2.0 children.[5]
Fertility and Births
Total Fertility Rate (TFR) (Wanted Fertility Rate) and Crude Birth Rate (CBR):[6] [7]
| Year | CBR (Total) | TFR (Total) | CBR (Urban) | TFR (Urban) | CBR (Rural) | TFR (Rural) |
|---|---|---|---|---|---|---|
| 1995-1998 | 29,0 | 4,11 | 25,0 | 3,31 | 29,0 | 4,25 |
| 2000 | 27,7 | 4,0 (3,1) | 23,9 | 3,1 (2,5) | 28,3 | 4,2 (3,2) |
| 2005 | 25,6 | 3,4 (2,8) | 23,8 | 2,8 (2,3) | 25,9 | 3,5 (2,9) |
| 2010 | 24,2 | 3,0 (2,6) | 21,0 | 2,2 (2,0) | 25,0 | 3,3 (2,8) |
| 2014 | 22,0 | 2,7 (2,4) | 20,2 | 2,1 (1,9) | 22,4 | 2,9 (2,6) |
Total fertility rate and other related statistics by province, as of 2014:[8]
| Province | Total fertility rate | Percentage of women age 15-49 currently pregnant | Mean number of children ever born to women age 40-49 |
|---|---|---|---|
| Banteay Meanchey | 2.8 | 5.2 | 4.0 |
| Kampong Cham | 3.3 | 3.5 | 3.9 |
| Kampong Chhnang | 2.4 | 5.4 | 4.2 |
| Kampong Speu | 2.4 | 6.3 | 4.1 |
| Kampong Thom | 2.9 | 5.8 | 4.4 |
| Kandal | 2.5 | 5.7 | 3.9 |
| Kratie | 3.6 | 7.3 | 4.5 |
| Phnom Penh | 2.0 | 4.6 | 2.8 |
| Prey Veng | 3.0 | 4.9 | 3.5 |
| Pursat | 3.1 | 5.9 | 4.0 |
| Siem Reap | 2.7 | 5.2 | 3.9 |
| Svay Rieng | 2.5 | 5.7 | 3.4 |
| Takeo | 2.4 | 3.9 | 3.7 |
| Otdar Meanchey | 3.0 | 8.5 | 4.6 |
| Battambang/Pailin | 2.9 | 5.5 | 3.8 |
| Kampot/Kep | 2.5 | 4.9 | 3.9 |
| Preah Sihanouk/Koh Kong | 2.7 | 5.8 | 4.1 |
| Preah Vihear/Stung Treng | 3.6 | 9.5 | 5.2 |
| Mondul Kiri/Ratanak Kiri | 3.3 | 6.9 | 4.8 |
Infant and childhood mortality
Childhood mortality rates are decreasing in Cambodia.[5] Currently, the infant mortality rate is 45 deaths per 1,000 live births for the five-year period before the survey compared with 66 deaths reported in the 2005 CDHS and 95 in the 2000 CDHS. Under-five mortality rates have also decreased from 124 deaths per 1,000 live births in 2000, 83 deaths in 2005 to 54 deaths per 1,000 in 2010.
Childhood mortality decreases markedly with mother’s education and wealth. Infant mortality, for example, is twice as high among children whose mothers have no schooling compared to those with secondary or higher education (72 versus 31). The association with wealth is even stronger. There are 77 deaths per 1,000 live births among infants from the poorest households compared to only 23 deaths per 1,000 live births among infants from the richest households.
Mortality rates are much higher in rural than urban areas. Infant mortality, for example, is 64 deaths per 1,000 live births in rural areas compared to only 22 in urban areas. Mortality also differs by province. Infant mortality ranges from only 13 deaths per 1,000 live births in Phnom Penh to 78 deaths per 1,000 live births in Kampong Chhnang and Svay Rieng.
Life expectancy
In 1959, life expectancy at birth was 44.2 years for males and 43.3 years for females. By 1970, life expectancy had increased by about 2.5 years since 1945. The greater longevity for females apparently reflected improved health practices during maternity and childbirth.
Ethnic groups
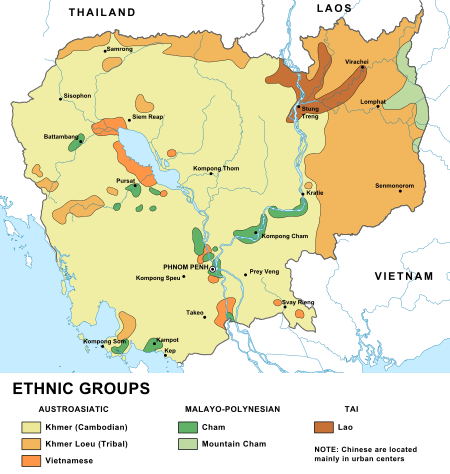
The largest of the ethnic groups in Cambodia are the Khmer, who comprise approximately 90% of the total population and primarily inhabit the lowland Mekong subregion and the central plains.
The Khmer historically have lived near the lower Mekong River in a contiguous arc that runs from the southern Khorat Plateau where modern-day Thailand, Laos and Cambodia meet in the northeast, stretching southwest through the lands surrounding Tonle Sap lake to the Cardamom Mountains, then continues back southeast to the mouth of the Mekong River in southeastern Vietnam.
Ethnic groups in Cambodia other than the politically and socially dominant Khmer are classified as either "indigenous ethnic minorities" or "non-indigenous ethnic minorities". The indigenous ethnic minorities, more commonly collectively referred to as the Khmer Loeu ("upland Khmer"), constitute the majority in the remote mountainous provinces of Ratanakiri, Mondulkiri and Stung Treng and are present in substantial numbers in Kratie Province.
Approximately 17-21 separate ethnic groups, most of whom speak Austroasiatic languages related to Khmer, are included in the Khmer Loeu designation, including the Kuy and Tampuan people. These peoples are considered by the Khmer to be the aboriginal inhabitants of the land. Two of these highland groups, the Rade and the Jarai, are Chamic peoples who speak Austronesian languages descended from ancient Cham. These indigenous ethnic minorities haven't integrated into Khmer culture and follow their traditional animist beliefs.
| Ethnic group | Population | % of total* |
|---|---|---|
| Khmer | 13,684,985 | 90% |
| Vietnamese | 760,277 | 5.0% |
| Chinese | 152,055 | 1% |
| Other | 608,222 | 4% |
The non-indigenous ethnic minorities include immigrants and their descendants who live among the Khmer and have adopted, at least nominally, Khmer culture and language. The three groups most often included are the Chinese Cambodians, Vietnamese and Cham peoples. The Chinese have immigrated to Cambodia from different regions of China throughout Cambodia's history, integrating into Cambodian society and today Chinese Cambodians or Cambodians of mixed Sino-Khmer ancestry dominate the business community, politics and the media. The Cham are descendants of refugees from the various wars of the historical kingdom of Champa. The Cham live amongst the Khmer in the central plains but in contrast to the Khmer who are Theravada Buddhists, the vast majority of Cham follow Islam.[9]
There are also small numbers of other minority groups. Tai peoples in Cambodia include the Lao along the Mekong at the northeast border, Thai (urban and rural), and the culturally Burmese Kola, who have visibly influenced the culture of Pailin Province. Even smaller numbers of recent Hmong immigrants reside along the Lao border and various Burmese peoples have immigrated to the capital, Phnom Penh.
Khmer 90%, Vietnamese 5%, Chinese 1%, other 4%.[10]
Languages
- Official language
- Khmer
- Languages of education
- English, French[11] (3%, 423,000 French speakers[12]).
- Minority languages
- Cham (2.2%), Vietnamese (0.8%), Tumpoon (0.4%);[13]
Lao, Jarai, Yue Chinese, and many small Mon–Khmer languages at < 0.25% - Sign languages
- American Sign Language
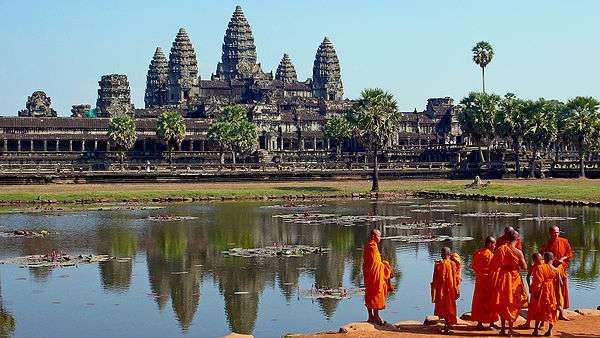
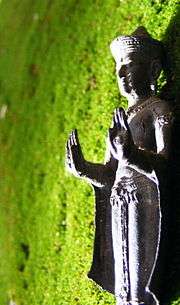
Religions
- Buddhism: 95%, Islam: 1.6%, Christianity: 0.2%, Others: 3.2%
CIA World Factbook demographic statistics
The following demographic statistics are from the CIA World Factbook, unless otherwise indicated.
Population
- 15,461,398
- Note: estimates for this country take into account the effects of excess mortality due to AIDS; this can result in lower life expectancy, higher infant mortality and death rates, lower population growth rates, and changes in the distribution of population by age and sex than would otherwise be expected (2011 est.)
Population growth rate
- 1.698% (2011 est.)
- 1.71% (2010 est.)
- 1.77% (2009 est.)
- 1.75% (2008 est)
Sex ratio
- At birth: 1.045 male(s)/female
- Under 15 years: 1.02 male(s)/female
- 15-64 years: 0.95 male(s)/female
- 65 years and over: 0.6 male(s)/female
- Total population: 0.96 male(s)/female (2011 est.)
Life expectancy at birth
- Total population: 64.14 years
- Male: 61.69 years
- Female: 66.7 years (2015 est.)
HIV/AIDS
adult prevalence rate
- 0.5% (2011 est.)
people living with HIV/AIDS
- 63,000 (2009 est.)
- 75,000 (2007 est.)
deaths
- 1,000 (2011 est.)
- 3,100 (2009 est.)
- 6,900 (2007 est.)
Nationality
- Noun: Cambodian(s) or Khmer(s)
- Adjective: Cambodian or Khmer
Urbanization
- Urban population: 24-69% of total population (2010 est.)
- Rate of urbanization: 4.6% rate of annual change (2005-10 est.)
Literacy
- Definition: age 15 and over can read and write
- Total population: 73.6%
- Male: 84.7%
- Female: 64.1% (2004 est.)
Educatate expendiure
- 1.7% of GDP (2004)
Overseas population
Countries with notable populations of overseas Cambodians are:
 Thailand
 Vietnam
 United States
 France
 Malaysia
 Australia
 Canada
 New Zealand
 China
China UK
UK Laos
Laos Singapore
 Hong Kong
References
| Wikimedia Commons has media related to Demographics of Cambodia. |
- ↑ http://www.factfish.com/statistic-country/cambodia/life+expectancy+at+birth,+male
- 1 2 Population Division of the Department of Economic and Social Affairs of the United Nations Secretariat, World Population Prospects: The 2010 Revision
- ↑ http://unstats.un.org/unsd/demographic/products/dyb/dyb2.htm
- ↑ http://unstats.un.org/unsd/demographic/products/vitstats/serATab3.pdf
- 1 2 3 4 5 National Institute of Statistics CAMBODIA DEMOGRAPHIC AND HEALTH SURVEY 2010
- ↑ http://microdata.worldbank.org/index.php/catalog/1421
- ↑ http://dhsprogram.com/pubs/pdf/FR251/OD43.pdf
- ↑ Cambodia DHS, 2014 - Final Report (English)
- ↑ "Cambodia Ethnic Groups". Cambodia-travel.com. Retrieved 2012-09-02.
- ↑ CIA factbook
- ↑ https://www.cia.gov/library/publications/the-world-factbook/geos/cb.html
- ↑ (French) La langue française dans le monde, 2014, Éditions Nathan, p. 18.
- ↑ Cambodia Inter-Censal Population Survey 2013
![]() This article incorporates public domain material from the CIA World Factbook document "2008 edition".
This article incorporates public domain material from the CIA World Factbook document "2008 edition".