Louis-Hébert (electoral district)
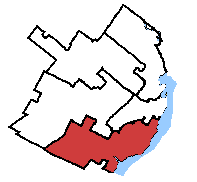 Louis-Hébert in relation to other Quebec City federal electoral districts. | |||
| Federal electoral district | |||
| Legislature | House of Commons | ||
| MP |
| ||
| District created | 1966 | ||
| First contested | 1968 | ||
| Last contested | 2015 | ||
| District webpage | profile, map | ||
| Demographics | |||
| Population (2011)[1] | 104,038 | ||
| Electors (2015) | 81,285 | ||
| Area (km²)[2] | 97 | ||
| Pop. density (per km²) | 1,072.6 | ||
| Census divisions | Quebec City | ||
| Census subdivisions | Quebec City | ||
Louis-Hébert (French pronunciation: [lwi ebɛʁ]) is a federal electoral district in the Canadian province of Quebec. Represented in the House of Commons since 1968, its population was certified, according to the detailed statistics of 2001, as 98,156.
Geography
The district, in the Quebec region of Capitale-Nationale, consists of the southern part of Quebec City, namely the borough of Sainte-Foy–Sillery–Cap-Rouge.
The neighbouring ridings are Portneuf—Jacques-Cartier, Louis-Saint-Laurent, Québec, Lévis—Bellechasse, and Lotbinière—Chutes-de-la-Chaudière.
The riding lost small fractions of territory to Louis-Saint-Laurent and Québec as a result of the 2012 electoral redistribution.
History
The electoral district was created in 1966 from Quebec East, Quebec South, Quebec West, and Québec—Montmorency ridings. The riding is notable for having had 9 different people represent the riding since 1988. Suzanne Duplessis was the last person to serve the riding for more than one parliament.
Members of Parliament
This riding has elected the following Members of Parliament:
| Parliament | Years | Member | Party | |
|---|---|---|---|---|
| Louis-Hébert Riding created from Quebec East, Quebec South, Quebec West and Québec—Montmorency |
||||
| 28th | 1968–1972 | Jean-Charles Cantin | Liberal | |
| 29th | 1972–1974 | Albanie Morin | ||
| 30th | 1974–1976 | |||
| 1977–1979 | Dennis Dawson | |||
| 31st | 1979–1980 | |||
| 32nd | 1980–1984 | |||
| 33rd | 1984–1988 | Suzanne Duplessis | Progressive Conservative | |
| 34th | 1988–1993 | |||
| 35th | 1993–1997 | Philippe Paré | Bloc Québécois | |
| 36th | 1997–2000 | Hélène Alarie | ||
| 37th | 2000–2004 | Hélène Scherrer | Liberal | |
| 38th | 2004–2006 | Roger Clavet | Bloc Québécois | |
| 39th | 2006–2008 | Luc Harvey | Conservative | |
| 40th | 2008–2011 | Pascal-Pierre Paillé | Bloc Québécois | |
| 41st | 2011–2015 | Denis Blanchette | New Democratic | |
| 42nd | 2015–Present | Joël Lightbound | Liberal | |
Election results
| Canadian federal election, 2015 | ||||||||
|---|---|---|---|---|---|---|---|---|
| Party | Candidate | Votes | % | ∆% | Expenditures | |||
| Liberal | Joël Lightbound | 21,516 | 34.85 | +21.43 | – | |||
| Conservative | Jean-Pierre Asselin | 16,789 | 27.19 | +5.36 | – | |||
| New Democratic | Denis Blanchette | 12,850 | 20.81 | -17.84 | – | |||
| Bloc Québécois | Caroline Pageau | 8,900 | 14.41 | -9.80 | – | |||
| Green | Andrée-Anne Beaudoin-Julien | 1,561 | 2.53 | +0.88 | – | |||
| Christian Heritage | Stefan Jetchick | 128 | 0.21 | -0.03 | – | |||
| Total valid votes/Expense limit | 61,744 | 100.00 | $217,520.39 | |||||
| Total rejected ballots | 627 | 1.01 | – | |||||
| Turnout | 62,371 | 76.90 | – | |||||
| Eligible voters | 81,109 | |||||||
| Liberal gain from New Democratic | Swing | +19.64 | ||||||
| Source: Elections Canada[3][4][5] | ||||||||
| 2011 federal election redistributed results[6] | |||
|---|---|---|---|
| Party | Vote | % | |
| New Democratic | 23,358 | 38.65 | |
| Bloc Québécois | 14,635 | 24.22 | |
| Conservative | 13,194 | 21.83 | |
| Liberal | 8,108 | 13.42 | |
| Green | 996 | 1.65 | |
| Others | 143 | 0.24 | |
| Canadian federal election, 2011 | ||||||||
|---|---|---|---|---|---|---|---|---|
| Party | Candidate | Votes | % | ∆% | Expenditures | |||
| New Democratic | Denis Blanchette | 23,373 | 38.65 | +29.32 | ||||
| Bloc Québécois | Pascal-Pierre Paillé | 14,640 | 24.21 | -12.02 | ||||
| Conservative | Pierre Paul-Hus | 13,207 | 21.84 | -6.37 | ||||
| Liberal | Jean Beaupré | 8,110 | 13.41 | -10.18 | ||||
| Green | Michelle Fontaine | 996 | 1.65 | -0.78 | ||||
| Christian Heritage | Marie-Claude Bouffard | 143 | 0.24 | +0.03 | ||||
| Total valid votes/Expense limit | 60,469 | 100.00 | ||||||
| Total rejected ballots | 636 | 1.04 | ||||||
| Turnout | 61,105 | 73.73 | ||||||
| New Democratic gain from Bloc Québécois | Swing | +20.67 | ||||||
| Canadian federal election, 2008 | ||||||||
|---|---|---|---|---|---|---|---|---|
| Party | Candidate | Votes | % | ∆% | Expenditures | |||
| Bloc Québécois | Pascal-Pierre Paillé | 20,992 | 36.23 | +2.15 | $78,716 | |||
| Conservative | Luc Harvey | 16,343 | 28.21 | -6.26 | $96,878 | |||
| Liberal | Jean Beaupré | 13,669 | 23.59 | +8.58 | $42,500 | |||
| New Democratic | Denis Blanchette | 5,403 | 9.33 | +0.26 | $7,979 | |||
| Green | Michelle Fontaine | 1,408 | 2.43 | -1.84 | ||||
| Christian Heritage | Stefan Jetchick | 119 | 0.21 | +0.01 | $383 | |||
| Total valid votes/Expense limit | 57,934 | 100.00 | $87,350 | |||||
| Total rejected ballots | 595 | 1.02 | ||||||
| Turnout | 58,529 | 70.29 | ||||||
| Bloc Québécois gain from Conservative | Swing | +4.21 | ||||||
| Canadian federal election, 2006 | ||||||||
|---|---|---|---|---|---|---|---|---|
| Party | Candidate | Votes | % | ∆% | Expenditures | |||
| Conservative | Luc Harvey | 20,332 | 34.47 | +21.02 | $63,705 | |||
| Bloc Québécois | Roger Clavet | 20,101 | 34.08 | -9.03 | $61,438 | |||
| Liberal | Hélène Scherrer | 8,852 | 15.01 | -19.02 | $43,177 | |||
| New Democratic | Denis Blanchette | 5,351 | 9.07 | +3.50 | $6,274 | |||
| Green | Robert Hudon | 2,517 | 4.27 | +0.44 | ||||
| Independent | Frédérick Têtu | 1,147 | 1.94 | – | $430 | |||
| Independent | Francis Fortin | 565 | 0.96 | – | $460 | |||
| Christian Heritage | Stefan Jetchick | 116 | 0.20 | – | $189 | |||
| Total valid votes/Expense limit | 58,981 | 100.00 | $81,438 | |||||
| Conservative gain from Bloc Québécois | Swing | +15.03 | ||||||
| Canadian federal election, 2004 | ||||||||
|---|---|---|---|---|---|---|---|---|
| Party | Candidate | Votes | % | ∆% | Expenditures | |||
| Bloc Québécois | Roger Clavet | 24,071 | 43.11 | +6.23 | $57,547 | |||
| Liberal | Hélène Scherrer | 18,999 | 34.03 | -7.11 | $58,530 | |||
| Conservative | Clermont Gauthier | 7,512 | 13.45 | -5.78 | $11,262 | |||
| New Democratic | Robert Turcotte | 3,112 | 5.57 | +3.49 | $2,646 | |||
| Green | Jean-Pierre Guay | 2,137 | 3.83 | – | ||||
| Total valid votes/Expense limit | 55,831 | 100.00 | $80,654 | |||||
| Bloc Québécois gain from Liberal | Swing | +6.67 | ||||||
Note: Conservative vote is compared to the total of the Canadian Alliance vote and Progressive Conservative vote in the 2000 election.
| Canadian federal election, 2000 | ||||||||
|---|---|---|---|---|---|---|---|---|
| Party | Candidate | Votes | % | ∆% | ||||
| Liberal | Hélène Scherrer | 23,695 | 41.14 | +7.52 | ||||
| Bloc Québécois | Hélène Alarie | 21,240 | 36.88 | -2.97 | ||||
| Alliance | Léonce-E. Roy | 5,887 | 10.22 | +8.50 | ||||
| Progressive Conservative | Clermont Gauthier | 5,189 | 9.01 | -12.90 | ||||
| New Democratic | Karl Adomeit | 1,200 | 2.08 | +0.13 | ||||
| Marxist–Leninist | Gisèle Desrochers | 382 | 0.66 | |||||
| Total valid votes | 57,593 | 100.00 | ||||||
| Liberal gain from Bloc Québécois | Swing | +5.25 | ||||||
Note: Canadian Alliance vote is compared to the Reform vote in 1997 election.
| Canadian federal election, 1997 | ||||||||
|---|---|---|---|---|---|---|---|---|
| Party | Candidate | Votes | % | ∆% | ||||
| Bloc Québécois | Hélène Alarie | 23,653 | 39.85 | -15.78 | ||||
| Liberal | Hélène Scherrer | 19,955 | 33.62 | +7.86 | ||||
| Progressive Conservative | Christian Lessard | 13,002 | 21.91 | +6.62 | ||||
| New Democratic | Karl Adomeit | 1,161 | 1.96 | +0.60 | ||||
| Reform | Gilles St-Laurent | 1,024 | 1.73 | |||||
| Natural Law | Réal Croteau | 558 | 0.94 | -0.51 | ||||
| Total valid votes | 59,353 | 100.00 | ||||||
| Bloc Québécois hold | Swing | +11.82 | ||||||
| Canadian federal election, 1993 | ||||||||
|---|---|---|---|---|---|---|---|---|
| Party | Candidate | Votes | % | ∆% | ||||
| Bloc Québécois | Philippe Paré | 33,683 | 55.63 | |||||
| Liberal | Margo Brousseau | 15,596 | 25.76 | +0.99 | ||||
| Progressive Conservative | Suzanne Duplessis | 9,254 | 15.28 | -44.49 | ||||
| Natural Law | Michel Nadeau | 878 | 1.45 | |||||
| New Democratic | Karl Adomeit | 823 | 1.36 | -11.67 | ||||
| Abolitionist | Raymond Guimond | 167 | 0.28 | |||||
| Commonwealth of Canada | Jacques Brochu | 145 | 0.24 | |||||
| Total valid votes | 60,546 | 100.00 | ||||||
| Bloc Québécois gain from Progressive Conservative | Swing | – | ||||||
| Canadian federal election, 1988 | ||||||||
|---|---|---|---|---|---|---|---|---|
| Party | Candidate | Votes | % | ∆% | ||||
| Progressive Conservative | Suzanne Duplessis | 37,329 | 59.77 | +13.81 | ||||
| Liberal | Nicole Duplé | 15,469 | 24.77 | -10.53 | ||||
| New Democratic | Pierre Lavigne | 8,139 | 13.03 | +1.24 | ||||
| Rhinoceros | Éric Houblon Ouellet | 1,515 | 2.43 | -0.70 | ||||
| Total valid votes | 62,452 | 100.00 | ||||||
| Progressive Conservative hold | Swing | +12.17 | ||||||
| Canadian federal election, 1984 | ||||||||
|---|---|---|---|---|---|---|---|---|
| Party | Candidate | Votes | % | ∆% | ||||
| Progressive Conservative | Suzanne Duplessis | 29,420 | 45.96 | +35.58 | ||||
| Liberal | Dennis Dawson | 22,592 | 35.30 | -29.46 | ||||
| New Democratic | Gilles Fiset | 7,548 | 11.79 | -2.19 | ||||
| Rhinoceros | Hélène Bernier | 2,003 | 3.13 | -4.05 | ||||
| Independent | Raymond Boisvert | 1,153 | 1.80 | |||||
| Parti nationaliste | Jean-Baptiste Giroux | 1,106 | 1.73 | |||||
| Social Credit | Sylvain Desbiens | 184 | 0.29 | -2.07 | ||||
| Total valid votes | 64,006 | 100.00 | ||||||
| Progressive Conservative gain from Liberal | Swing | +32.52 | ||||||
| Canadian federal election, 1980 | ||||||||
|---|---|---|---|---|---|---|---|---|
| Party | Candidate | Votes | % | ∆% | ||||
| Liberal | Dennis Dawson | 34,231 | 64.75 | -1.25 | ||||
| New Democratic | Robert Caron | 7,392 | 13.98 | +3.86 | ||||
| Progressive Conservative | Michel Doyon | 5,490 | 10.39 | +4.60 | ||||
| Rhinoceros | François Ouellet | 3,795 | 7.18 | |||||
| Social Credit | Jean-Paul Rhéaume | 1,247 | 2.36 | -13.83 | ||||
| Union populaire | Henri Laberge | 596 | 1.13 | -0.17 | ||||
| Marxist–Leninist | Lynda Forgues | 112 | 0.21 | -0.40 | ||||
| Total valid votes | 52,863 | 100.00 | ||||||
| Canadian federal election, 1979 | ||||||||
|---|---|---|---|---|---|---|---|---|
| Party | Candidate | Votes | % | ∆% | ||||
| Liberal | Dennis Dawson | 37,908 | 66.00 | -6.25 | ||||
| Social Credit | Henri Gariépy | 9,297 | 16.19 | +12.31 | ||||
| New Democratic | Jean Daoust | 5,812 | 10.12 | |||||
| Progressive Conservative | Maxime Langlois | 3,322 | 5.78 | -15.69 | ||||
| Union populaire | Michel Tremblay | 746 | 1.30 | |||||
| Marxist–Leninist | Lynda Forgues | 351 | 0.61 | |||||
| Total valid votes | 57,436 | 100.00 | ||||||
| Canadian federal by-election, 24 May 1977 | ||||||||
|---|---|---|---|---|---|---|---|---|
| Party | Candidate | Votes | % | ∆% | ||||
| On Mrs. Morin's death, 1 October 1976 | ||||||||
| Liberal | Dennis Dawson | 30,763 | 72.25 | +4.22 | ||||
| Progressive Conservative | Jean Lavoie | 9,142 | 21.47 | +10.57 | ||||
| Social Credit | Daniel Boulay | 1,652 | 3.88 | -1.99 | ||||
| Communist | Hervé Fuyet | 1,021 | 2.40 | |||||
| Total valid votes | 42,578 | 100.00 | ||||||
| Canadian federal election, 1974 | ||||||||
|---|---|---|---|---|---|---|---|---|
| Party | Candidate | Votes | % | ∆% | ||||
| Liberal | Albanie Morin | 32,441 | 68.03 | +10.21 | ||||
| New Democratic | Françoise Gamache Stanton | 6,829 | 14.32 | -0.17 | ||||
| Progressive Conservative | Blanche Boucher | 5,201 | 10.91 | -3.24 | ||||
| Social Credit | Rosaire Proulx | 2,799 | 5.87 | -2.86 | ||||
| Marxist–Leninist | Robert Lapointe | 419 | 0.88 | |||||
| Total valid votes | 47,689 | 100.00 | ||||||
| Canadian federal election, 1972 | ||||||||
|---|---|---|---|---|---|---|---|---|
| Party | Candidate | Votes | % | ∆% | ||||
| Liberal | Albanie Morin | 30,928 | 57.82 | -6.49 | ||||
| New Democratic | Françoise Stanton | 7,750 | 14.49 | +9.81 | ||||
| Progressive Conservative | Cécile Bergeron | 7,566 | 14.14 | -4.48 | ||||
| Social Credit | Ghislaine Clavet | 4,672 | 8.73 | -3.65 | ||||
| Independent | Lisette Pouliot | 1,490 | 2.79 | |||||
| Independent | Henri Tremblay | 1,085 | 2.03 | |||||
| Total valid votes | 53,491 | 100.00 | ||||||
Note: Social Credit vote is compared to Ralliement créditiste vote in the 1968 election.
| Canadian federal election, 1968 | ||||||||
|---|---|---|---|---|---|---|---|---|
| Party | Candidate | Votes | % | |||||
| Liberal | Jean-Charles Cantin | 28,220 | 64.31 | |||||
| Progressive Conservative | Gérard Berlinguette | 8,174 | 18.63 | |||||
| Ralliement créditiste | Jean Turgeon | 5,433 | 12.38 | |||||
| New Democratic | Gaétan Dutil | 2,054 | 4.68 | |||||
| Total valid votes | 43,881 | 100.00 | ||||||
See also
References
- "(Code 24037) Census Profile". 2011 census. Statistics Canada. 2012. Retrieved 2011-03-07.
- Campaign expense data from Elections Canada
- Riding history from the Library of Parliament