Notre-Dame-de-Grâce—Westmount
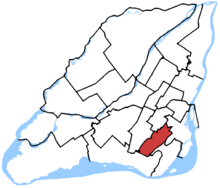 Notre-Dame-de-Grâce—Westmount in relation to other federal electoral districts in Montreal and Laval (2013 boundaries) | |||
| Federal electoral district | |||
| Legislature | House of Commons | ||
| MP |
| ||
| District created | 2013 | ||
| First contested | 2015 | ||
| District webpage | profile, map | ||
| Demographics | |||
| Population (2011)[1] | 104,410 | ||
| Electors (2015) | 79,071 | ||
| Area (km²)[1] | 17 | ||
| Pop. density (per km²) | 6,141.8 | ||
| Census divisions | Montreal (part) | ||
| Census subdivisions | Montreal (part), Montréal-Ouest, Westmount | ||
Notre-Dame-de-Grâce—Westmount is a new federal electoral district in Quebec. It encompasses a portion of Quebec formerly included in the electoral districts of Notre-Dame-de-Grâce—Lachine (40%), Westmount—Ville-Marie (59%) and Outremont (1%).[2]
Notre-Dame-de-Grâce—Westmount was created by the 2012 federal electoral boundaries redistribution and was legally defined in the 2013 representation order. It came into effect upon the call of the 42nd Canadian federal election, which took place 19 October 2015.[3]
Geography
The riding includes the cities of Westmount and Montréal-Ouest as well as part of the borough of Côte-des-Neiges–Notre-Dame-de-Grâce in Montreal.
Members of Parliament
This riding has elected the following Members of Parliament:
| Parliament | Years | Member | Party | |
|---|---|---|---|---|
| Notre-Dame-de-Grâce—Westmount Riding created from Notre-Dame-de-Grâce—Lachine, Outremont and Westmount—Ville-Marie |
||||
| 42nd | 2015–Present | Marc Garneau | Liberal | |
Election results
| Canadian federal election, 2015 | ||||||||
|---|---|---|---|---|---|---|---|---|
| Party | Candidate | Votes | % | ∆% | Expenditures | |||
| Liberal | Marc Garneau | 29,755 | 57.67 | +19.43 | – | |||
| New Democratic | James Hughes | 11,229 | 21.76 | -13.29 | – | |||
| Conservative | Richard Sagala | 7,414 | 14.37 | -3.28 | – | |||
| Green | Melissa Kate Wheeler | 1,581 | 3.06 | -1.32 | – | |||
| Bloc Québécois | Simon Quesnel | 1,282 | 2.48 | -1.59 | $2,358.94 | |||
| Marxist–Leninist | Rachel Hoffman | 181 | 0.35 | – | – | |||
| Independent | Lisa Julie Cahn | 151 | 0.29 | – | – | |||
| Total valid votes/Expense limit | 51,593 | 100.00 | – | $214,383.86 | ||||
| Total rejected ballots | 311 | 0.60 | – | – | ||||
| Turnout | 51,904 | 65.21 | – | – | ||||
| Eligible voters | 79,597 | – | – | – | ||||
| Source: Elections Canada[4][5] | ||||||||
| 2011 federal election redistributed results[6] | |||
|---|---|---|---|
| Party | Vote | % | |
| Liberal | 17,072 | 38.24 | |
| New Democratic | 15,648 | 35.05 | |
| Conservative | 7,878 | 17.65 | |
| Green | 1,955 | 4.38 | |
| Bloc Québécois | 1,816 | 4.07 | |
| Others | 271 | 0.61 | |
References
.png)
This article is issued from Wikipedia - version of the 2/18/2016. The text is available under the Creative Commons Attribution/Share Alike but additional terms may apply for the media files.