Papineau (electoral district)
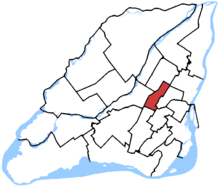 Papineau in relation to other federal electoral districts in Montreal and Laval (2013 boundaries) | |||
| Federal electoral district | |||
| Legislature | House of Commons | ||
| MP |
| ||
| District created | 2003 | ||
| First contested | 2004 | ||
| Last contested | 2015 | ||
| District webpage | profile, map | ||
| Demographics | |||
| Population (2011)[1] | 108,977 | ||
| Electors (2015) | 78,515 | ||
| Area (km²)[2] | 10 | ||
| Pop. density (per km²) | 10,897.7 | ||
| Census divisions | Montreal | ||
| Census subdivisions | Montreal | ||
Papineau (formerly Papineau—Saint-Denis and Papineau—Saint-Michel) is a federal electoral district in Montreal, Quebec, Canada, that has been represented in the House of Commons of Canada from 1948 to 1988 and since 2004. Its population in 2006 was 101,019. Justin Trudeau, who is currently Prime Minister of Canada and Leader of the Liberal Party, has represented the riding since the 2008 federal election.
The name of the riding comes from a street in the Villeray neighbourhood, named after Joseph Papineau.
At nine square kilometres, it covers the second smallest area of any federal riding in Canada, after Toronto Centre.[3] Linguistically, 45% of residents list French as their mother tongue, 8% list English, and 47% list neither English nor French, with large groups speaking Spanish, Italian, Greek and Arabic. The total immigrant population is 40 per cent.[4]
Geography
The district includes the neighbourhoods of Villeray and Park Extension, and the southern part of the old city of Saint-Michel in the Borough of Villeray–Saint-Michel–Parc-Extension. The southeast corner of the riding borders the Outremont riding, which is held by Tom Mulcair, the leader of the New Democratic Party.
Political geography
Papineau, despite its small size, is a very divided riding. The riding spans the former linguistic divide of the city, Saint Laurent Boulevard. South of the riding is the neighbourhood of Park Extension, which is very Liberal. The central part of the riding, around Villeray, was Bloc Québécois territory for almost two decades before swinging heavily to the NDP in the 2011 federal election. And François-Perreault district, in the south of Saint-Michel, is considered as swing territory between the Liberals and the NDP. The district of Saint-Michel, which is part of neighbouring Saint-Léonard—Saint-Michel riding to the northeast of Papineau, leans to the Liberals.
Except for the years 2006 to 2008, when it was held by Vivian Barbot of the Bloc, the seat has been in Liberal hands since 1953.
History
The electoral district of Papineau was created in 1947 from parts of the Hochelaga, Mercier, St. James and Saint-Denis ridings.
The riding was abolished in 1987 when it was redistributed between the Papineau—Saint-Michel, Rosemont and Saint-Denis ridings.
In 2003, a new "Papineau" riding was created from parts of the Papineau—Saint-Michel riding.
This riding gained territory from Outremont and Saint-Léonard—Saint-Michel during the 2012 electoral redistribution.
Former boundaries
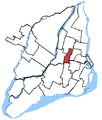 2004 to 2011 election
Members of Parliament
This riding has elected the following Members of Parliament:
| Parliament | Years | Member | Party | |
|---|---|---|---|---|
| Papineau Riding created from Hochelaga, Mercier, St. James and Saint-Denis |
||||
| 21st | 1949–1953 | Camillien Houde | Independent | |
| 22nd | 1953–1957 | Adrien Meunier | Independent Liberal | |
| 23rd | 1957–1958 | Liberal | ||
| 24th | 1958–1962 | |||
| 25th | 1962–1963 | |||
| 26th | 1963–1965 | Guy Favreau | ||
| 27th | 1965–1967 | |||
| 1967–1968 | André Ouellet | |||
| 28th | 1968–1972 | |||
| 29th | 1972–1974 | |||
| 30th | 1974–1979 | |||
| 31st | 1979–1980 | |||
| 32nd | 1980–1984 | |||
| 33rd | 1984–1988 | |||
| Papineau—Saint-Michel | ||||
| 34th | 1988–1993 | André Ouellet | Liberal | |
| 35th | 1993–1996 | |||
| 1996–1997 | Pierre Pettigrew | |||
| Papineau—Saint-Denis | ||||
| 36th | 1997–2000 | Pierre Pettigrew | Liberal | |
| 37th | 2000–2004 | |||
| Papineau | ||||
| 38th | 2004–2006 | Pierre Pettigrew | Liberal | |
| 39th | 2006–2008 | Vivian Barbot | Bloc Québécois | |
| 40th | 2008–2011 | Justin Trudeau | Liberal | |
| 41st | 2011–2015 | |||
| 42nd | 2015–Present | |||
Election results
Papineau, 2003 - present
| Canadian federal election, 2015 | ||||||||
|---|---|---|---|---|---|---|---|---|
| Party | Candidate | Votes | % | ∆% | Expenditures | |||
| Liberal | Justin Trudeau | 26,391 | 51.98 | +14.05 | – | |||
| New Democratic | Anne Lagacé Dowson | 13,132 | 25.87 | -3.6 | – | |||
| Bloc Québécois | Maxime Claveau | 6,182 | 12.18 | -12.71 | – | |||
| Conservative | Yvon Vadnais | 2,390 | 4.71 | -0.33 | – | |||
| Green | Danny Polifroni | 1,443 | 2.84 | +0.95 | – | |||
| Independent | Chris Lloyd | 505 | 0.99 | – | – | |||
| Rhinoceros | Tommy Gaudet | 323 | 0.64 | – | – | |||
| Independent | Kim Waldron | 159 | 0.31 | – | – | |||
| Marxist–Leninist | Peter Macrisopoulos | 142 | 0.28 | -0.25 | – | |||
| No affiliation | Beverly Bernardo | 103 | 0.2 | – | – | |||
| Total valid votes/Expense limit | 50,770 | 100.0 | $213,091.50 | |||||
| Total rejected ballots | 698 | – | – | |||||
| Turnout | 51,468 | – | – | |||||
| Eligible voters | 78,649 | |||||||
| Source: Elections Canada[5][6] | ||||||||
| 2011 federal election poll-by-poll redistribution[7] | |||
|---|---|---|---|
| Party | Vote | % | |
| Liberal | 17,407 | 37.93 | |
| New Democratic | 13,625 | 29.47 | |
| Bloc Québécois | 11,421 | 24.89 | |
| Conservative | 2,314 | 5.04 | |
| Green | 868 | 1.89 | |
| Others | 357 | 0.78 | |
| Canadian federal election, 2011 | ||||||||
|---|---|---|---|---|---|---|---|---|
| Party | Candidate | Votes | % | ∆% | ||||
| Liberal | Justin Trudeau | 16,429 | 38.41 | −3.06 | ||||
| New Democratic | Marcos Radhames Tejada | 12,102 | 28.29 | +19.55 | ||||
| Bloc Québécois | Vivian Barbot | 11,091 | 25.93 | −12.76 | ||||
| Conservative | Shama Chopra | 2,021 | 4.73 | −2.90 | ||||
| Green | Danny Polifroni | 806 | 1.88 | −0.96 | ||||
| Marxist–Leninist | Peter Macrisopoulos | 228 | 0.53 | |||||
| Not affiliated1 | Joseph Young | 95 | 0.22 | |||||
| Total valid votes | 42,772 | 100.0 | ||||||
| Total rejected ballots | 588 | |||||||
| Turnout | 43,330 | |||||||
| Source: Official Results, Elections Canada. 1 Communist League | ||||||||
| Canadian federal election, 2008 | ||||||||
|---|---|---|---|---|---|---|---|---|
| Party | Candidate | Votes | % | ∆% | Expenditures | |||
| Liberal | Justin Trudeau | 17,724 | 41.47 | +2.99 | $76,857 | |||
| Bloc Québécois | Vivian Barbot | 16,535 | 38.69 | -2.06 | $70,872 | |||
| New Democratic | Costa Zafiropoulos | 3,734 | 8.74 | +1.04 | $5,745 | |||
| Conservative | Mustaque Sarker | 3,262 | 7.63 | -0.69 | $44,958 | |||
| Green | Ingrid Hein | 1,213 | 2.84 | -0.76 | $814 | |||
| Independent | Mahmood Raza Baig | 267 | 0.62 | +0.20 | ||||
| Total valid votes/Expense limit | 42,735 | 100.00 | $81,172 | |||||
| Total rejected ballots | 576 | 1.33 | ||||||
| Turnout | 43,311 | |||||||
| Note: Baig's share of popular vote as an independent candidate is compared to his share in the 2006 general election as a Canadian Action Party candidate. | ||||||||
| Sources: Official Results, Elections Canada and Financial Returns, Elections Canada. | ||||||||
| Canadian federal election, 2006 | ||||||||
|---|---|---|---|---|---|---|---|---|
| Party | Candidate | Votes | % | ∆% | Expenditures | |||
| Bloc Québécois | Vivian Barbot | 17,775 | 40.75 | +0.79 | $50,886 | |||
| Liberal | Pierre Pettigrew | 16,785 | 38.48 | -2.62 | $75,541 | |||
| Conservative | Mustaque Sarker | 3,630 | 8.32 | +3.55 | $34,951 | |||
| New Democratic | Marc Hasbani | 3,358 | 7.70 | -1.07 | $2,568 | |||
| Green | Louis-Philippe Verenka | 1,572 | 3.60 | +1.03 | $181 | |||
| Marxist–Leninist | Peter Macrisopoulos | 317 | 0.73 | +0.32 | ||||
| Canadian Action | Mahmood-Raza Baig | 185 | 0.42 | – | $2,007 | |||
| Total valid votes/Expense limit | 43,622 | 100.00 | $76,023 | |||||
| Canadian federal election, 2004 | ||||||||
|---|---|---|---|---|---|---|---|---|
| Party | Candidate | Votes | % | ∆% | Expenditures | |||
| Liberal | Pierre Pettigrew | 16,892 | 41.10 | -13.00 | ||||
| Bloc Québécois | Martine Carrière | 16,424 | 39.96 | +13.36 | $48,511 | |||
| New Democratic | André Frappier | 3,603 | 8.77 | +4.29 | $28,566 | |||
| Conservative | Mustaque Sarker | 1,961 | 4.77 | -2.74 | $38,564 | |||
| Green | Adam Jastrzebski | 1,058 | 2.57 | +0.02 | ||||
| Marijuana | Christelle Dusablon-Pelletier | 490 | 1.19 | -0.81 | ||||
| Communist | André Parizeau | 252 | 0.61 | $825 | ||||
| Independent | Jimmy Garoufalis | 250 | 0.61 | $2,607 | ||||
| Marxist–Leninist | Peter Macrisopoulos | 169 | 0.41 | +0.68 | ||||
| Total valid votes/Expense limit | 41,099 | 100.00 | $75,103 | |||||
| Note: Conservative vote is compared to the total of the Canadian Alliance vote and Progressive Conservative vote in 2000 election, and not the vote Sarker received as an independent candidate. | ||||||||
Papineau—Saint-Denis, 1996 - 2003
| Canadian federal election, 2000: Papineau—Saint-Denis | ||||||||
|---|---|---|---|---|---|---|---|---|
| Party | Candidate | Votes | % | ∆% | ||||
| Liberal | Pierre Pettigrew | 23,955 | 54.10 | +0.20 | ||||
| Bloc Québécois | Philippe Ordenes | 11,779 | 26.60 | -2.31 | ||||
| Alliance | Yannis Felemegos | 2,114 | 4.77 | -8.01 | ||||
| New Democratic | Hans Marotte | 1,983 | 4.48 | +2.03 | ||||
| Progressive Conservative | Emmanuel Préville | 1,215 | 2.74 | -10.04 | ||||
| Green | Boris-Antoine Legault | 1,128 | 2.55 | |||||
| Marijuana | Antoine Théorêt-Poupart | 886 | 2.00 | |||||
| Independent | Mustaque Sarker | 738 | 1.67 | |||||
| Marxist–Leninist | Peter Macrisopoulos | 482 | 1.09 | +0.10 | ||||
| Total valid votes/Expense limit | 44,280 | 100.00 | ||||||
Note: Canadian Alliance vote compared to the vote Felemegos received as a Progressive Conservative candidate.
| Canadian federal election, 1997: Papineau—Saint-Denis | ||||||||
|---|---|---|---|---|---|---|---|---|
| Party | Candidate | Votes | % | ∆% | Expenditures | |||
| Liberal | Pierre Pettigrew | 26,260 | 53.90 | -5.30 | $53,271 | |||
| Bloc Québécois | Mario Beaulieu | 14,083 | 28.91 | -5.02 | $25,032 | |||
| Progressive Conservative | Yannis Felemegos | 6,227 | 12.78 | +10.43 | $19,274 | |||
| New Democratic | Gaby Kombé | 1,196 | 2.45 | -1.02 | $3,030 | |||
| Marxist–Leninist | Peter Macrisopoulos | 481 | 0.99 | $0 | ||||
| Independent | Michel Dugré | 471 | 0.97 | $270 | ||||
| Total valid votes/Expense limit | 41,099 | 100.00 | ||||||
Papineau—Saint-Michel, 1987 - 1996
| Canadian federal by-election, March 25, 1996: Papineau—Saint-Michel | ||||||||
|---|---|---|---|---|---|---|---|---|
| Party | Candidate | Votes | % | ∆% | ||||
| Liberal | Pierre Pettigrew | 15,330 | 59.20 | +7.22 | ||||
| Bloc Québécois | Daniel Turp | 8,787 | 33.93 | +5.31 | ||||
| New Democratic | Raymond Laurent | 899 | 3.47 | +1.64 | ||||
| Progressive Conservative | Nicole Roy-Arcelin | 608 | 2.35 | -2.02 | ||||
| Reform | Martin Masse | 272 | 1.05 | |||||
| Total valid votes/Expense limit | 25,896 | 100.00 | ||||||
| Canadian federal election, 1993: Papineau—Saint-Michel | ||||||||
|---|---|---|---|---|---|---|---|---|
| Party | Candidate | Votes | % | ∆% | ||||
| Liberal | André Ouellet | 20,064 | 51.98 | +5.99 | ||||
| Bloc Québécois | Daniel Boucher | 15,148 | 39.24 | |||||
| Progressive Conservative | Carmen De Pontbriand | 1,686 | 4.37 | -28.86 | ||||
| New Democratic | Gisèle Charlebois | 708 | 1.83 | -13.27 | ||||
| Natural Law | André Beaudoin | 678 | 1.76 | |||||
| Marxist–Leninist | Serge Lachapelle | 141 | 0.37 | |||||
| Abolitionist | P. A. D'Aoust | 98 | 0.25 | |||||
| Commonwealth of Canada | Normand Normandeau | 78 | 0.20 | -0.24 | ||||
| Total valid votes/Expense limit | 38,601 | 100.00 | ||||||
| Canadian federal election, 1988: Papineau—Saint-Michel | ||||||||
|---|---|---|---|---|---|---|---|---|
| Party | Candidate | Votes | % | ∆% | ||||
| Liberal | André Ouellet | 18,122 | 45.99 | +7.00 | ||||
| Progressive Conservative | Frank Venneri | 13,094 | 33.23 | -3.62 | ||||
| New Democratic | Giovanni Adamo | 5,948 | 15.10 | +1.97 | ||||
| Rhinoceros | Carole Ola Clermont | 987 | 2.51 | -3.38 | ||||
| Green | H. Joseph Vega | 469 | 1.19 | |||||
| Communist | Line Chabot | 235 | 0.60 | +0.15 | ||||
| Independent | Francine Tremblay | 193 | 0.49 | |||||
| Independent | Michel Dugré | 178 | 0.45 | |||||
| Commonwealth of Canada | Normand Bélanger | 174 | 0.44 | +0.09 | ||||
| Total valid votes/Expense limit | 39,400 | 100.00 | ||||||
Papineau, 1947 - 1987
| Canadian federal election, 1984 | ||||||||
|---|---|---|---|---|---|---|---|---|
| Party | Candidate | Votes | % | ∆% | ||||
| Liberal | André Ouellet | 12,754 | 38.99 | -35.69 | ||||
| Progressive Conservative | Tony Iacobaccio | 12,053 | 36.85 | +31.40 | ||||
| New Democratic | Paul Comtois | 4,295 | 13.13 | +3.81 | ||||
| Rhinoceros | Christian Jolicoeur | 1,925 | 5.89 | +0.52 | ||||
| Parti nationaliste | Gilles Maillé | 1,169 | 3.57 | |||||
| Communist | Suzanne Dagenais | 147 | 0.45 | +0.22 | ||||
| Social Credit | Roland Mireault | 147 | 0.45 | -2.88 | ||||
| Commonwealth of Canada | Gilles Gervais | 113 | 0.35 | |||||
| Independent | Doris Lacroix | 104 | 0.32 | |||||
| Total valid votes | 32,707 | 100.00 | ||||||
| Canadian federal election, 1980 | ||||||||
|---|---|---|---|---|---|---|---|---|
| Party | Candidate | Votes | % | ∆% | ||||
| Liberal | André Ouellet | 22,399 | 74.69 | +6.21 | ||||
| New Democratic | Jean-Marc Dompierre | 2,796 | 9.32 | +3.78 | ||||
| Progressive Conservative | Gérard Hogue | 1,634 | 5.45 | -2.24 | ||||
| Rhinoceros | La Mule Louis Harvey | 1,608 | 5.36 | +1.28 | ||||
| Social Credit | Albert Paiement | 999 | 3.33 | -8.38 | ||||
| Independent | Ghislaine Cloutier | 245 | 0.82 | |||||
| Union populaire | Lucie Desrosiers | 170 | 0.57 | +0.13 | ||||
| Marxist–Leninist | Michel Gauthier | 71 | 0.24 | -0.18 | ||||
| Communist | Danielle Ferland | 68 | 0.23 | -0.22 | ||||
| Total valid votes | 29,990 | 100.00 | ||||||
| Canadian federal election, 1979 | ||||||||
|---|---|---|---|---|---|---|---|---|
| Party | Candidate | Votes | % | ∆% | ||||
| Liberal | André Ouellet | 23,619 | 68.48 | +6.59 | ||||
| Social Credit | Albert Paiement | 4,039 | 11.71 | -0.64 | ||||
| Progressive Conservative | Claudy Mailly | 2,652 | 7.69 | -8.24 | ||||
| New Democratic | Jean A. Richard | 1,913 | 5.55 | -2.94 | ||||
| Rhinoceros | Jacques Hurtubise | 1,409 | 4.09 | |||||
| Independent | Raymond Beaudoin | 412 | 1.19 | |||||
| Communist | Claire Demers | 153 | 0.44 | -0.25 | ||||
| Union populaire | Jean Saint-Amour | 150 | 0.43 | |||||
| Marxist–Leninist | Michel Gauthier | 144 | 0.42 | -0.24 | ||||
| Total valid votes | 34,491 | 100.00 | ||||||
| Canadian federal election, 1974 | ||||||||
|---|---|---|---|---|---|---|---|---|
| Party | Candidate | Votes | % | ∆% | ||||
| Liberal | André Ouellet | 14,532 | 61.89 | +8.46 | ||||
| Progressive Conservative | Léon Vellone | 3,740 | 15.93 | +1.29 | ||||
| Social Credit | Albert Paiement | 2,899 | 12.35 | -7.85 | ||||
| New Democratic | Paul Marsan | 1,992 | 8.48 | -2.37 | ||||
| Communist | Richard Ducharme | 164 | 0.70 | |||||
| Marxist–Leninist | Robert Wallace | 155 | 0.66 | |||||
| Total valid votes | 23,482 | 100.00 | ||||||
| Canadian federal election, 1972 | ||||||||
|---|---|---|---|---|---|---|---|---|
| Party | Candidate | Votes | % | ∆% | ||||
| Liberal | André Ouellet | 15,347 | 53.43 | -9.78 | ||||
| Social Credit | Albert Paiement | 5,802 | 20.20 | +15.39 | ||||
| Progressive Conservative | Angelo Tiveron | 4,205 | 14.64 | -3.68 | ||||
| New Democratic | Paul Marsan | 3,118 | 10.85 | -0.45 | ||||
| Independent | Robert Wallace | 254 | 0.88 | |||||
| Total valid votes | 28,726 | 100.00 | ||||||
Note: Social Credit vote is compared to Ralliement créditiste vote in the 1968 election.
| Canadian federal election, 1968 | ||||||||
|---|---|---|---|---|---|---|---|---|
| Party | Candidate | Votes | % | ∆% | ||||
| Liberal | André Ouellet | 14,379 | 63.20 | +5.23 | ||||
| Progressive Conservative | René Paquin | 4,168 | 18.32 | 0.00 | ||||
| New Democratic | Pierre Demers | 2,572 | 11.31 | -3.36 | ||||
| Ralliement créditiste | Jean-Louis Marier | 1,094 | 4.81 | |||||
| Démocratisation Économique | Guy-Gilles Lacombe | 537 | 2.36 | |||||
| Total valid votes | 22,750 | 100.00 | ||||||
| Canadian federal by-election, 29 May 1967 | ||||||||
|---|---|---|---|---|---|---|---|---|
| Party | Candidate | Votes | % | ∆% | ||||
| On Mr. Favreau's resignation, 4 April 1967 | ||||||||
| Liberal | André Ouellet | 6,197 | 57.97 | +4.87 | ||||
| Progressive Conservative | Raymond Rochon | 1,958 | 18.32 | +1.25 | ||||
| New Democratic | Michel Bissonnet | 1,568 | 14.67 | +1.21 | ||||
| Radical chrétien | Albert Paiement | 702 | 6.57 | |||||
| Independent | Albert Cameron | 265 | 2.48 | +0.42 | ||||
| Total valid votes | 10,690 | 100.00 | ||||||
| Canadian federal election, 1965 | ||||||||
|---|---|---|---|---|---|---|---|---|
| Party | Candidate | Votes | % | ∆% | ||||
| Liberal | Guy Favreau | 13,920 | 53.10 | +0.73 | ||||
| Progressive Conservative | Basil Danchyshyn | 4,474 | 17.07 | +2.52 | ||||
| New Democratic | Arturo Moretti | 3,529 | 13.46 | +2.14 | ||||
| Ralliement créditiste | Albert Paiement | 2,367 | 9.03 | -7.54 | ||||
| Independent Liberal | Léo-C. Morin | 1,090 | 4.16 | |||||
| Independent | Albert Cameron | 540 | 2.06 | |||||
| Republican | Lucien Rivard | 297 | 1.13 | |||||
| Total valid votes | 26,217 | 100.00 | ||||||
Note: Ralliement créditiste vote is compared to Social Credit vote in the 1963 election.
| Canadian federal election, 1963 | ||||||||
|---|---|---|---|---|---|---|---|---|
| Party | Candidate | Votes | % | ∆% | ||||
| Liberal | Guy Favreau | 15,677 | 52.37 | -2.56 | ||||
| Social Credit | Albert Paiement | 4,959 | 16.56 | +10.82 | ||||
| Progressive Conservative | Alphonse Thérien | 4,353 | 14.54 | -14.25 | ||||
| New Democratic | Paul-Émile Trudel | 3,388 | 11.32 | +0.77 | ||||
| Ouvrier Indépendant | Lionel Bécotte | 1,064 | 3.55 | |||||
| Candidat libéral des électeurs | Vincent Ialenti | 496 | 1.66 | |||||
| Total valid votes | 29,937 | 100.00 | ||||||
| Canadian federal election, 1962 | ||||||||
|---|---|---|---|---|---|---|---|---|
| Party | Candidate | Votes | % | ∆% | ||||
| Liberal | Adrien Meunier | 16,062 | 54.93 | +2.01 | ||||
| Progressive Conservative | Alphonse Thérien | 8,418 | 28.79 | -12.68 | ||||
| New Democratic | Vianney Desjardins | 3,083 | 10.54 | +6.74 | ||||
| Social Credit | Ferruccio Ariano | 1,680 | 5.74 | |||||
| Total valid votes | 29,243 | 100.00 | ||||||
Note: NDP vote is compared to CCF vote in 1958 election.
| Canadian federal election, 1958 | ||||||||
|---|---|---|---|---|---|---|---|---|
| Party | Candidate | Votes | % | ∆% | ||||
| Liberal | Adrien Meunier | 18,466 | 52.92 | -25.43 | ||||
| Progressive Conservative | Claude Danis | 14,468 | 41.46 | +28.03 | ||||
| Co-operative Commonwealth | Jean Riopel | 1,328 | 3.81 | -4.41 | ||||
| Independent | Archie Luccisano | 632 | 1.81 | |||||
| Total valid votes | 34,894 | 100.00 | ||||||
| Canadian federal election, 1957 | ||||||||
|---|---|---|---|---|---|---|---|---|
| Party | Candidate | Votes | % | ∆% | ||||
| Liberal | Adrien Meunier | 24,373 | 78.35 | +40.79 | ||||
| Progressive Conservative | Gaston Rodier | 4,177 | 13.43 | -5.05 | ||||
| Co-operative Commonwealth | Jean Riopel | 2,556 | 8.22 | +6.30 | ||||
| Total valid votes | 31,106 | 100.00 | ||||||
| Canadian federal election, 1953 | ||||||||
|---|---|---|---|---|---|---|---|---|
| Party | Candidate | Votes | % | ∆% | ||||
| Independent Liberal | Adrien Meunier | 10,387 | 38.65 | |||||
| Liberal | Émile Dufresne | 10,094 | 37.56 | -10.15 | ||||
| Progressive Conservative | Jules A. Le Beau | 4,966 | 18.48 | +16.24 | ||||
| Independent Liberal | Armand Meunier | 576 | 2.14 | |||||
| Co-operative Commonwealth | Raymond Pineau | 514 | 1.91 | -0.15 | ||||
| Labor–Progressive | Germaine Leclerc | 337 | 1.25 | |||||
| Total valid votes | 26,874 | 100.00 | ||||||
| Canadian federal election, 1949 | ||||||||
|---|---|---|---|---|---|---|---|---|
| Party | Candidate | Votes | % | |||||
| Independent | Camillien Houde | 12,611 | 48.00 | |||||
| Liberal | J.-Adrien Meunier | 12,536 | 47.71 | |||||
| Progressive Conservative | Wilfred Kendall | 587 | 2.23 | |||||
| Co-operative Commonwealth | J.-E. Léopold Cadieux | 541 | 2.06 | |||||
| Total valid votes | 26,275 | 100.00 | ||||||
See also
| Wikinews has related news: Justin Trudeau wins Liberal Party nomination |
References
- "(Code 24048) Census Profile". 2011 census. Statistics Canada. 2012. Retrieved 2011-03-07.
- Riding history 1948-1988 from the Library of Parliament
- Riding history 2004-present from the Library of Parliament
- 2011 Results from Elections Canada
- Campaign expense data from Elections Canada
Notes
- ↑ Statistics Canada: 2012
- ↑ Statistics Canada: 2012
- ↑ Banerjee, Sidhartha (15 October 2008). "Leave leader talk to the pundits, rookie MP Justin Trudeau focused on riding". The Canadian Press. Retrieved 2008-10-15.
- ↑ "Canada Votes 2008: Papineau". CBC News. 15 October 2008. Retrieved 2008-10-15.
- ↑ Elections Canada – Confirmed candidates for Papineau, 30 September 2015
- ↑ Elections Canada – Preliminary Election Expenses Limits for Candidates
- ↑ Pundits' Guide to Canadian Elections
| Parliament of Canada | ||
|---|---|---|
| Preceded by Calgary Southwest |
Constituency represented by the Prime Minister 2015–present |
Succeeded by Incumbent |
.png)