Demographics of Djibouti
| Demographics of Djibouti | |
|---|---|
| Population | 810,178 (2014) |
| Growth rate | 2.23% (2014) |
| Birth rate | 25.27 births/1,000 population (2011 est.) |
| Death rate | 8.23 deaths/1,000 population (July 2011 est.) |
| Life expectancy | 62.4 years (2014) |
| • male | 59.93 years |
| • female | 64.94 years |
| Fertility rate | 2.79 children born/woman (2010) |
| Infant mortality rate | 53.31 deaths/1,000 infants (2012 est.)[1] |
| Age structure | |
| 0–14 years | 35% (male 132,592/female 132,114) |
| 15–64 years | 61.7% (male 206,323/female 260,772) |
| 65 and over | 3.3% (male 11,349/female 13,924) |
| Sex ratio | |
| At birth | 1.03 male(s)/female |
| Under 15 | 1 male(s)/female |
| 15–64 years | 0.8 male(s)/female |
| 65 and over | 0.81 male(s)/female |
| Nationality | |
| Nationality | Djiboutian |
| Major ethnic |
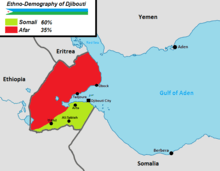
Somali 60% Afar 35% |
| Minor ethnic |
French Arab Ethiopian Total 5% |
| Language | |
| Spoken | Arabic (official), French (official), Somali, Afar |
This article is about the demographics of Djibouti, including population density, ethnicity, education level, health, economic status, religious affiliations and other aspects of the population.
Ethnic groups

Djibouti is a multiethnic country. As of 2015, it has a population of around 846,687 inhabitants.[2] Djibouti's population grew rapidly during the latter half of the 20th century, increasing from about 62,000 in 1950 to 889,000 by 2010.[3]
The two largest ethnic groups are the Somali (60%) and the Afar (35%). The Somali clan component is mainly composed of the Issas, a sub-clan of the larger Dir. The remaining 5% of Djibouti's population primarily consists of Arabs, Ethiopians and Europeans (French and Italians). Approximately 76% of local residents are urban dwellers; the remainder are pastoralists.[2]
Languages
Djibouti is a multilingual nation.[2] The majority of local residents speak Somali (524,000 speakers) and Afar (306,000 speakers) as a first language. These idioms are the mother tongues of the Somali and Afar ethnic groups, respectively. Both languages belong to the larger Afroasiatic family. There are two official languages in Djibouti: Arabic (Afroasiatic) and French (Indo-European).[4]
Arabic is of social, cultural and religious importance. In formal settings, it consists of Modern Standard Arabic. Colloquially, about 59,000 local residents speak the Ta'izzi-Adeni Arabic dialect, also known as Djibouti Arabic. French serves as a statutory national language. It was inherited from the colonial period, and is the primary language of instruction. Around 17,000 Djiboutians speak it as a first language. Immigrant languages include Omani Arabic (38,900 speakers), Amharic (1,400 speakers), Greek (1,000 speakers) and Hindi (600 speakers).[4]
Population
| 1960–2012 | ||
|---|---|---|
| Year | Pop. | ±% p.a. |
| 1960 | 83,636 | — |
| 1969 | 149,887 | +6.70% |
| 1977 | 277,750 | +8.02% |
| 1980 | 359,247 | +8.95% |
| 1994 | 652,793 | +4.36% |
| 2000 | 722,887 | +1.71% |
| 2012 | 859,652 | +1.45% |
| Source: World Bank[5] | ||
According to the 2010 revision of the UN's World Population Prospects, the total population was 889,000 in 2010 compared to 62,000 in 1950. The proportion of children below the age of 15 in 2010 was 35.8%, 60.9% was between 15 and 65 years of age, while 3.3% was 65 years or older.[3]
| Total population (x 1000) | Population aged 0–14 (%) | Population aged 15–64 (%) | Population aged 65+ (%) | |
|---|---|---|---|---|
| 1950 | 62 | 46.8 | 51.2 | 2.0 |
| 1955 | 70 | 46.0 | 52.0 | 2.0 |
| 1960 | 85 | 45.4 | 52.5 | 2.0 |
| 1965 | 117 | 44.9 | 53.0 | 2.0 |
| 1970 | 162 | 45.8 | 52.2 | 2.1 |
| 1975 | 224 | 45.9 | 52.0 | 2.1 |
| 1980 | 340 | 45.3 | 52.5 | 2.2 |
| 1985 | 403 | 44.6 | 53.1 | 2.3 |
| 1990 | 562 | 44.2 | 53.4 | 2.4 |
| 1995 | 627 | 43.4 | 54.1 | 2.5 |
| 2000 | 732 | 41.3 | 55.9 | 2.7 |
| 2005 | 808 | 38.5 | 58.5 | 3.0 |
| 2010 | 889 | 35.8 | 60.9 | 3.3 |
Projections
The following are UN medium variant projections; numbers are in thousands:[3]
- 2015 975
- 2020 1,065
- 2025 1,166
- 2030 1,262
- 2035 1,356
- 2040 1,447
- 2045 1,535
- 2050 1,619
Vital statistics
Registration of vital events in Djibouti is incomplete. The Population Department of the United Nations prepared the following estimates.[3]
| Period | Live births per year | Deaths per year | Natural change per year | CBR* | CDR* | NC* | TFR* | IMR* |
|---|---|---|---|---|---|---|---|---|
| 1950-1955 | 3 000 | 2 000 | 1 000 | 50.0 | 28.3 | 21.7 | 7.80 | 222 |
| 1955-1960 | 4 000 | 2 000 | 2 000 | 50.7 | 25.7 | 25.0 | 7.80 | 203 |
| 1960-1965 | 5 000 | 2 000 | 3 000 | 51.2 | 23.8 | 27.4 | 7.80 | 185 |
| 1965-1970 | 7 000 | 3 000 | 4 000 | 50.3 | 21.6 | 28.6 | 7.60 | 169 |
| 1970-1975 | 9 000 | 4 000 | 5 000 | 47.8 | 19.4 | 28.4 | 7.20 | 154 |
| 1975-1980 | 13 000 | 5 000 | 8 000 | 45.2 | 17.4 | 27.8 | 6.80 | 141 |
| 1980-1985 | 16 000 | 6 000 | 11 000 | 44.0 | 15.5 | 28.6 | 6.60 | 125 |
| 1985-1990 | 21 000 | 7 000 | 14 000 | 43.1 | 14.5 | 28.6 | 6.40 | 117 |
| 1990-1995 | 24 000 | 8 000 | 16 000 | 40.1 | 13.4 | 26.7 | 5.85 | 109 |
| 1995-2000 | 23 000 | 8 000 | 15 000 | 34.4 | 12.2 | 22.2 | 5.11 | 100 |
| 2000-2005 | 24 000 | 9 000 | 15 000 | 31.2 | 11.3 | 19.9 | 4.52 | 91 |
| 2005-2010 | 25 000 | 9 000 | 16 000 | 29.4 | 10.5 | 18.9 | 3.95 | 82 |
| * CBR = crude birth rate (per 1000); CDR = crude death rate (per 1000); NC = natural change (per 1000); IMR = infant mortality rate per 1000 births; TFR = total fertility rate (number of children per woman) | ||||||||
Births and deaths [6]
| Year | Population | Live births | Deaths | Natural increase | Crude birth rate | Crude death rate | Rate of natural increase | TFR |
|---|---|---|---|---|---|---|---|---|
| 2009 | 9 853 | 1 082 | 8 771 | |||||
| 2010 | 10 538 | 1 051 | 9 487 | |||||
| 2011 | 10 871 | 1 011 | 9 860 | |||||
Demographic statistics
The following demographic statistics are from the CIA World Factbook,[2] unless otherwise indicated.
Population
- 828,324 (July 2015 est.)
Median age
Total: 22.8 years
Male: 21.1 years
Female: 24.1 years (2014 est.)
Population growth rate
- 2.23% (2014 est.)
Urbanization
- urban population: 77.1% of total population (2011)
- rate of urbanization: 1.96% annual rate of change (2010-15 est.)
Major cities - population
- DJIBOUTI (capital) 529,000 (2015)
Sex ratio
- at birth: 1.03 male(s)/female
- under 15 years: 1 male(s)/female
- 15-24 years: 0.89 male(s)/female
- 25-54 years: 0.71 male(s)/female
- 55-64 years: 0.85 male(s)/female
- 65 years and over: 0.82 male(s)/female
- total population: 0.86 male(s)/female (2014 est.)
Life expectancy at birth
Total population: 62.4 years
Male: 59.93 years
Female: 64.94 years (2014 est.)
HIV/AIDS
- adult prevalence rate: 1.2% (2012 est.)
- people living with HIV/AIDS: 7,700 (2012 est.)
- deaths: 800 (2012 est.)
Major infectious diseases
- degree of risk: high
- food or waterborne diseases: bacterial and protozoal diarrhea, hepatitis A, and typhoid fever
- vectorborne disease: dengue fever
note: highly pathogenic H5N1 avian influenza has been identified in this country; it poses a negligible risk with extremely rare cases possible among US citizens who have close contact with birds (2013)
Nationality
- Djiboutien or Djiboutian
Ethnic groups
Somali 60%, Afar 35%, French and Italians, Arab, Ethiopian 5%[2]
Religions
The religious adherents of Djibouti are:[2]
- Muslim 94%
- Christian 6%
Languages
The languages of Djibouti are:[2]
Literacy
- definition: age 15 and over can read and write
- total population: 67.9%
- male: 60%
- female: 58.4% (2003 est.)
See also
| Wikimedia Commons has media related to Demographics of Djibouti. |
References
[1]; column-width: 1
[1]; list-style-type: decimal;">
- 1 2 3 "CIA – The World Factbook: Infant Mortality Rate". Archived from the original on December 18, 2012. Retrieved December 18, 2012.
- 1 2 3 4 5 6 7 "Africa :: Djibouti". CIA The World Factbook.
- 1 2 3 4 Population Division of the Department of Economic and Social Affairs of the United Nations Secretariat, World Population Prospects: The 2010 Revision
- 1 2 "Djibouti - Languages". Ethnologue. Retrieved 6 September 2016.
- ↑ "World Bank". Retrieved 26 October 2015.
- ↑ http://unstats.un.org/unsd/demographic/products/dyb/dyb2.htm


