Port Sanilac, Michigan
| Port Sanilac, Michigan | |
|---|---|
| Village | |
 | |
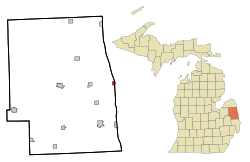 Location of Port Sanilac, Michigan | |
| Coordinates: 43°25′53″N 82°32′37″W / 43.43139°N 82.54361°WCoordinates: 43°25′53″N 82°32′37″W / 43.43139°N 82.54361°W | |
| Country | United States |
| State | Michigan |
| County | Sanilac |
| Area[1] | |
| • Total | 0.80 sq mi (2.07 km2) |
| • Land | 0.80 sq mi (2.07 km2) |
| • Water | 0 sq mi (0 km2) |
| Elevation | 610 ft (186 m) |
| Population (2010)[2] | |
| • Total | 623 |
| • Estimate (2012[3]) | 614 |
| • Density | 778.8/sq mi (300.7/km2) |
| Time zone | Eastern (EST) (UTC-5) |
| • Summer (DST) | EDT (UTC-4) |
| ZIP code | 48469 |
| Area code(s) | 810 |
| FIPS code | 26-65900[4] |
| GNIS feature ID | 0635267[5] |
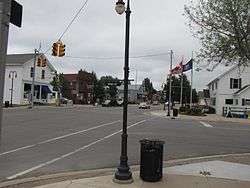
Port Sanilac is a village in Sanilac Township, Sanilac County in the U.S. state of Michigan. The population was 623 at the 2010 census.
History
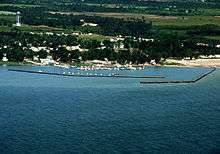
This village was originally a lumberjack settlement on the shore of Lake Huron named "Bark Shanty." In the late 1840s and 1850s, the settlement gained its first sawmill, schoolhouse, and general store. In 1854, Bark Shanty's first post office opened. In 1857 the village was renamed to Port Sanilac, as it is in Sanilac Township in Sanilac County. Local legend attributes the name to a Wyandotte Indian Chief named Sanilac.[6] See List of Michigan county name etymologies.
Local landmarks include the Port Sanilac lighthouse (burning kerosene from its opening in 1886 until its electrification in 1924) and a twenty-room Victorian mansion (now a museum) built in 1872 by a horse-and-buggy doctor, Dr. Joseph Loop.
The Sanilac Shores Underwater Preserve is a designated ship wreck preserve that is very popular with scuba divers.
Geography
According to the United States Census Bureau, the village has a total area of 0.80 square miles (2.07 km2), all land.[1] It is located at 43°25′56″N 82°32′33″W / 43.43222°N 82.54250°W. It is considered to be part of the Thumb of Michigan, which in turn is a subregion of the Flint/Tri-Cities.
Demographics
| Historical population | |||
|---|---|---|---|
| Census | Pop. | %± | |
| 1880 | 595 | — | |
| 1900 | 314 | — | |
| 1910 | 216 | −31.2% | |
| 1920 | 135 | −37.5% | |
| 1930 | 147 | 8.9% | |
| 1940 | 204 | 38.8% | |
| 1950 | 247 | 21.1% | |
| 1960 | 361 | 46.2% | |
| 1970 | 493 | 36.6% | |
| 1980 | 598 | 21.3% | |
| 1990 | 656 | 9.7% | |
| 2000 | 658 | 0.3% | |
| 2010 | 623 | −5.3% | |
| Est. 2015 | 604 | [7] | −3.0% |
2010 census
As of the census[2] of 2010, there were 623 people, 290 households, and 175 families residing in the village. The population density was 778.8 inhabitants per square mile (300.7/km2). There were 441 housing units at an average density of 551.3 per square mile (212.9/km2). The racial makeup of the village was 97.3% White, 0.2% African American, 0.3% Native American, 0.3% Asian, 0.2% from other races, and 1.8% from two or more races. Hispanic or Latino of any race were 2.2% of the population.
There were 290 households of which 23.1% had children under the age of 18 living with them, 44.8% were married couples living together, 10.0% had a female householder with no husband present, 5.5% had a male householder with no wife present, and 39.7% were non-families. 36.6% of all households were made up of individuals and 19.6% had someone living alone who was 65 years of age or older. The average household size was 2.09 and the average family size was 2.66.
The median age in the village was 51.1 years. 19.9% of residents were under the age of 18; 3.2% were between the ages of 18 and 24; 18.6% were from 25 to 44; 33% were from 45 to 64; and 25.4% were 65 years of age or older. The gender makeup of the village was 45.4% male and 54.6% female.
2000 census
As of the census[4] of 2000, there were 658 people, 319 households, and 176 families residing in the village. The population density was 908.8 per square mile (352.9/km2). There were 437 housing units at an average density of 603.6 per square mile (234.3/km2). The racial makeup of the village was 96.66% White, 0.76% Native American, 0.15% Asian, 0.61% from other races, and 1.82% from two or more races. Hispanic or Latino of any race were 2.13% of the population.
There were 319 households out of which 20.7% had children under the age of 18 living with them, 44.5% were married couples living together, 9.1% had a female householder with no husband present, and 44.8% were non-families. 42.0% of all households were made up of individuals and 26.6% had someone living alone who was 65 years of age or older. The average household size was 2.03 and the average family size was 2.77.
In the village the population was spread out with 19.9% under the age of 18, 8.8% from 18 to 24, 20.1% from 25 to 44, 22.3% from 45 to 64, and 28.9% who were 65 years of age or older. The median age was 46 years. For every 100 females there were 77.8 males. For every 100 females age 18 and over, there were 72.2 males.
The median income for a household in the village was $28,409, and the median income for a family was $38,250. Males had a median income of $30,795 versus $21,875 for females. The per capita income for the village was $18,153. About 4.8% of families and 7.8% of the population were below the poverty line, including 15.3% of those under age 18 and 7.1% of those age 65 or over.
Media
A list of popular radio stations are below...
- 630 AM CFCO Country
- 660 AM WMIC Country, News, Talk.
- 950 AM WWJ News
- 1380 AM WPHM News
- 1450 AM WHLS Rock
- 92.5 FM WBGV Country
- 95.9 FM CFPL Rock
- 96.9 FM WBTI Top 40
- 97.7 FM WTGV Easy Listening, Soft Rock, Sports
- 103.7 FM WCZE Country
- 106.3 FM CHKS Rock
- 107.1 FM WSAQ Country
TV Stations
- Channel 2 WJBK Detroit (Fox News)
- Channel 4 WDIV Detroit (NBC)
- Channel 5 WNEM-TV Saginaw-Bay City (CBS)
- Channel 7 WXYZ-TV Detroit (ABC)
Education
Carsonville-Port Sanilac Schools has a combined high school and middle school off M-46 between Port Sanilac and Carsonville. Port Sanilac's last elementary school closed in the early 1980s and the building is now used as the Bark Shanty Community Center. Elementary students are bused to nearby Carsonville.
Notes
- 1 2 "US Gazetteer files 2010". United States Census Bureau. Retrieved 2012-11-25.
- 1 2 "American FactFinder". United States Census Bureau. Retrieved 2012-11-25.
- ↑ "Population Estimates". United States Census Bureau. Retrieved 2013-06-03.
- 1 2 "American FactFinder". United States Census Bureau. Retrieved 2008-01-31.
- ↑ "US Board on Geographic Names". United States Geological Survey. 2007-10-25. Retrieved 2008-01-31.
- ↑ Michigan government on origin of county names
- ↑ "Annual Estimates of the Resident Population for Incorporated Places: April 1, 2010 to July 1, 2015". Retrieved July 2, 2016.
- ↑ "Census of Population and Housing". Census.gov. Retrieved June 4, 2015.
Further reading
- Clarke Historical Library, Central Michigan University, Bibliography on Sanilac County
- Raymond, Oliver. Shingle Shavers and Berry Pickers. (Port Sanilac, MI: Raymond), 1976.
External links
- Official site
- Carsonville-Port Sanilac Schools
- "Historic Light Station Information and Photography: Michigan". United States Coast Guard Historian's Office.
- Map of Michigan Lighthouse in PDF Format.
- Blue Water Convention and Visitors Bureau
Municipalities and communities of Sanilac County, Michigan, United States | ||
|---|---|---|
| Cities |  | |
| Villages | ||
| Townships | ||
| CDP | ||
| Other unincorporated communities | ||
| Footnotes | ‡This populated place also has portions in an adjacent county or counties | |