Solar power in Kentucky
Solar power in Kentucky has been growing in recent years due to new technological improvements and a variety of regulatory actions and financial incentives, particularly a 30% federal tax credit, available through 2016, for any size project. Kentucky could generate 10% of all of the electricity used in the United States from land cleared from coal mining in the state. Covering just one-fifth with photovoltaics would supply all of the state's electricity.[1]
The Berea Solar Farm is a community solar farm, which opened with 60 235-watt solar panels (14.1 kW).[2] All of the available panels sold out in four days.[3]
A 2 MW single axis tracking solar farm began operation in 2011 in Bowling Green.[4][5] As of 2011, the largest system on any farm in the state was the 100.32 kW array completed on November 1, 2011, in Fancy Farms.[6] The first hospital in the state to use solar power is Rockcastle Regional Hospital in Mt. Vernon, which installed a 60.9 kW array on the roof in November, 2011.[7]
In 2015, Fort Campbell installed a 1.9MW solar farm that provides 10% of the electricity used by the base.[8]
Kentucky's only maker of solar panels is Alternative Energy Kentucky.[9]
Net metering
Kentucky has a net metering program that allows installations of up to 30 kW of on-site electrical generation to continuously roll over any excess generation to the next month. Participation is limited to 1% of utilities peak demand the prior year.[10] The Kentucky Solar Energy Society is lobbying to increase the limit, noting that 17 states allow at least 2 MW capacity to use net metering.[11] Three states have no limit - Arizona, New Jersey, and Ohio.[12] Rhode Island has a 5 MW limit,[13] and New Mexico has a limit of 80 MW.[14]
Insolation
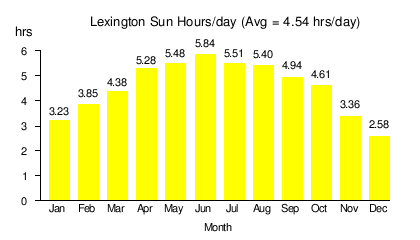
Kentucky has an average of about 4.5 sun hours per day, similar to Germany which is at 4.8 sun hours per day.[15] [16]

- Source: NREL[17]
Installed capacity
| Kentucky Grid-Connected PV Capacity (MW)[18][19][20][21][22][23] | |||
|---|---|---|---|
| Year | Capacity | Installed | % Change |
| 2010 | 0.2 | 0.2 | |
| 2011 | 3.3 | 3.0 | 1550% |
| 2012 | 4.8 | 1.5 | 45% |
| 2013 | 7.9 | 3.2 | 68% |
| 2014 | 8.4 | 0.5 | 6% |
| 2015 | 9.5 | 1.1 | 13% |
See also
References
- ↑ Can Coal Mines Become Solar Farms?
- ↑ Berea Solar Farm
- ↑ Berea (KY) Solar Farm Sells Out
- ↑ Solar installations in Kentucky
- ↑ Bowling Green To Have $6M, 10-Acre Solar Farm
- ↑ Willet Farm's Press Release
- ↑ Kentucky's First Solar-Powered Hospital
- ↑ Fort Campbell solar array completed, ClarksvilleNow, September 21, 2015
- ↑ Company says the future of solar panels in Ky. is bright
- ↑ "Kentucky - Net Metering". Retrieved 2012-05-23.
- ↑ Net Metering
- ↑ Net Metering as a Business Retention Tool
- ↑ Rhode Island - Net Metering
- ↑ New Mexico - Net Metering
- ↑ Can the sun power your Kentucky home?
- ↑ "Solar Energy".
- ↑ "PV Watts". NREL. Retrieved 23 May 2012.
- ↑ Sherwood, Larry (August 2012). "U.S. Solar Market Trends 2011" (PDF). Interstate Renewable Energy Council (IREC). Retrieved 2012-08-16.
- ↑ Sherwood, Larry (June 2011). "U.S. Solar Market Trends 2010" (PDF). Interstate Renewable Energy Council (IREC). p. 20. Retrieved 2011-06-29.
- ↑ Sherwood, Larry (July 2009). "U.S. Solar Market Trends 2008" (PDF). Interstate Renewable Energy Council (IREC). p. 16. Retrieved 2010-07-24.
- ↑ Sherwood, Larry (July 2012). "U.S. Solar Market Trends 2012" (PDF). Interstate Renewable Energy Council (IREC). p. 16. Retrieved 2013-10-11.
- ↑ Sherwood, Larry (July 2014). "U.S. Solar Market Trends 2013" (PDF). Interstate Renewable Energy Council (IREC). Retrieved 2014-09-26.
- ↑ Kentucky Solar
External links
- Incentives and policies
- Kentucky Division of Renewable Energy - Solar Energy
- Kentucky Solar Energy Society