Solar power in California

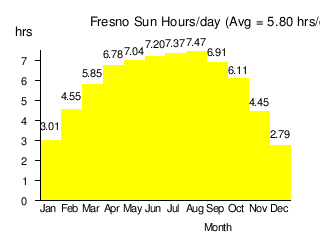
Solar power in California has been growing rapidly because of high insolation, community support, declining solar costs, and a Renewable Portfolio Standard which requires that 33% of California's electricity come from renewable resources by 2020, and 50% by 2030.[1] Much of this is expected to come from solar power. At noon on July 12, 2016, California generated 8 GW of utility scale solar power and around 4 GW of behind-the-meter private solar power.[2]
In 2014, utility-scale solar power in California generated 9.9 million megawatt-hours, more than double the amount generated in 2013, and more than five percent of total utility-scale electrical generation in the state.[3] The American Solar Energy Industries Association reports that a further 19,200 MW of utility-scale solar projects are under construction or development in the state as of August 2014.[4]
History
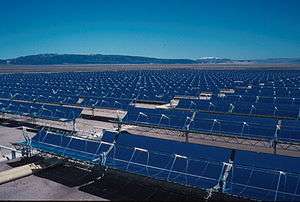
Over the last 20 years, California has been home to a number of "world's largest" solar facilities. In 1991, the 354 MW solar thermal Solar Energy Generating Systems plant (located in the Mojave Desert in San Bernardino County, California) held the title until being bested by the 392 MW Ivanpah Solar Electric Generating System, a concentrated solar thermal plant located in San Bernardino County near the Nevada border. In 2014, the 550 MW Topaz Solar Farm became the new "world's largest operational" solar facility went online in Riverside County, California. A second 550 MW facility by First Solar, Desert Sunlight Solar Farm, also went online in Riverside County in 2014. Both these were superseded, however, by the Solar Star photovoltaic project that went online with 579 MW in June 2015 in Antelope Valley, California (located on Los Angeles and Kern counties). While California hosts the three largest photovoltaic facilities in the world (as of July 2015), there are yet several proposals for even larger facilities seeking regulatory approval in California.[5]
California also leads the nation in the number of homes which have solar panels installed, totaling over 230,000.[6] Many were installed because of the Million Solar Roof Initiative.[7]
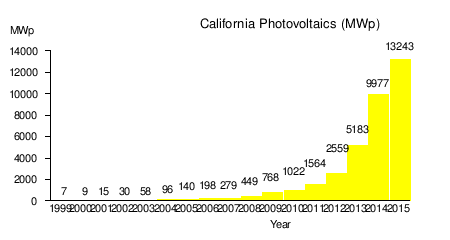
As of the end of 2013, California had 490 MW of concentrated solar power and 5,183 MW of photovoltaics capacity in operation.[8]
Photovoltaics
In 2011, California's goal to install 3,000 MW by 2016 was expanded to 12,000 MW by 2020 (and exceeded in 2015).[9] California has more photovoltaics installed than any other state, and 48% of the total in 2010. For the first time in 2008 the installed photovoltaics exceeded the state's 354 MW of solar thermal (CSP).[10][11][12] There are plans to build over 15,000 MW of utility scale photovoltaic plants in California.[13] At the end of 2012, small systems of less than 10 kWp were averaging $5.39/W, and large systems of over 500 kWp were averaging $2.77/W.[14]
California has the technical potential to install 128.9 GW of rooftop solar panels, which would generate 194,000 GWh/year, about 74% of the total electricity used in California in 2013. 128 GW, though, is three to four times as much electricity as is used, which requires that most of the noon output will need to be stored (for example by producing hydrogen) or exported on a sunny day.[15]
 |
|
Under construction
- The Blythe Solar Power Project is a planned 485 MW photovoltaic power station to be located in Riverside County.
- The California Flats Solar Project is a planned 280 MW photovoltaic power station to be located in Monterey County.[17]
Operational
- The Desert Sunlight Solar Farm is a 550 MW solar power plant in Riverside County, that uses thin-film solar CdTe-modules made by First Solar. The plant was completed in December 2014.[18]
- The Imperial Valley Solar Project is a 99 MW power station, located in Imperial County.
- The California Valley Solar Ranch (CVSR) is a 250 MW solar photovoltaic power plant, built by SunPower in the Carrizo Plain, northeast of California Valley.[19]
- The Mount Signal Solar project was completed near the Mexican border in May 2014. The installed PV capacity of the solar farm amounts to 265.7 MW (206 MWAC).[20][21][22]
- The 550 MW Topaz Solar Farm in San Luis Obispo County was completed in November 2014. It was the world’s largest PV power plant at the time.
Solar thermal power
The Ivanpah Solar Electric Generating System (392 MW), located 40 miles (60 km) southwest of Las Vegas, is the world's largest solar thermal power project.[23] The project is developed by BrightSource Energy and Bechtel.[24] The project has received a $1.375 billion loan guarantee from the United States Department of Energy. It deploys 347,000 heliostat mirrors focusing solar energy on boilers located on centralized solar power towers.[23]
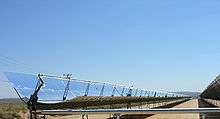
The Genesis Solar Energy Project is an operational 250 MW solar thermal power station located in Riverside County, California. It features a parabolic trough design and is run by NextEra Energy Resources.[25]
Operational
- The Solar Energy Generating Systems, is a 361 MW (was 394 MW until 2014) parabolic trough concentrated solar power station located in the Mojave Desert completed in 1990.
- The Genesis Solar Energy Project, is a 280 MW parabolic trough concentrated solar power station located in the Mojave Desert completed in 2013.
- The Ivanpah Solar Power Facility, is a 392 MW solar power tower concentrated solar power station located in the Mojave Desert completed in 2014.
- The Mojave Solar Project, is a 280 MW parabolic trough concentrated solar power station located in the Mojave Desert completed in 2014.
Total operational installed gross power is 1,313 MW (1346 MW until 2014). Production in 2015 was 2,309 GWh, 71.2% of U.S. total solar thermal generation.[26]
2012 priority projects
In 2012, the Bureau of Land Management is giving priority status to 5 solar project proposals in California.[20] The 750 MW McCoy Solar Energy Project has been proposed by NextEra. The 100 MW Desert Harvest project has been proposed by enXco. The 664 MW Calico Solar Energy Project has been redesigned by K Power but later abandoned.[27]
Public opinion
The majority of Californians in desert country support large-scale solar development, according to a 2012 survey conducted on behalf of BrightSource Energy. The survey of more than 1,000 people was conducted throughout Imperial, Inyo, Kern, Riverside, San Bernardino counties in California, where many utility-scale solar projects are underway or planned. Survey results showed that nearly four out of five (almost 80 percent) of people strongly supported development of solar power in their communities. The survey also found that the majority of people were concerned with climate change. It also found that two-thirds of respondents think renewable energy is important to California’s future and that the state and federal government should help provide incentives for renewable energy projects.[28]
Renewable Portfolio Standard
Solar power in California has been growing rapidly, because of a Renewable Portfolio Standard which requires that 20% of California's electricity come from renewable resources by 2010, and 33% by 2020. Much of this is expected to come from solar power.
According to a recent report by the California Public Utilities Commission, California failed to meet the 20% renewables by 2010 target. Pacific Gas & Electric and Southern California Edison were the closest to meeting the goal. PG&E generated 17.7% of the electricity it sold in 2010 from renewable sources while SCE was the closest to hitting the RPS goal by producing 19.4% of its electricity from renewable sources in 2010. San Diego Gas & Electric, on the other hand, generated only 11.9% of its electricity from renewable sources in 2010.[29]
As of July 2014, California had 7,808 MW[30] of solar and 5,830 MW[31] of wind farms. California adopted feed-in tariffs, a tool similar to what Europe has been using, to encourage the solar power industry. Proposals were raised aiming to create a small-scale solar market in California that brings the benefits of the German market, such as distributed generation, which avoids the need for transmission because power is generated close to where it is used, and avoid the drawbacks such as excessively high payments that could become a burden on utility customers.[32]
California Solar Initiative
The California Solar Initiative is a 2006 initiative to install 3,000 MW of additional solar power by 2016. Included in it is the Million Solar Roof Initiative.[33] In 2011, this goal was expanded to 12,000 MW by 2020.[34]
According to the CPUC, homeowners, businesses, and local governments installed 158 MW of solar photovoltaics (PV) in 2008, doubling the 78 MW installed in 2007, giving California a cumulative total of 441 MW of distributed solar PV systems, the highest in the country.[35] As of August 2016, 4,216 MW have been installed in 537,647 projects. The average cost of systems less than 10 kW is $5.33/watt and $4.38/watt for systems over 10 kW.[36] Of these, 3,391 MW were rooftop solar in 2015.[37]
Many of the homes, schools and businesses which have installed solar panels can be monitored online on the Internet.[38][39]
Generation
Utility-scale California solar electric generation according to the Energy Information Administration (EIA):
| Year | Generation (GWh) |
Generation (% of CA total) |
Generation (% of USA Solar) |
|---|---|---|---|
| 2010[40] | 769 | 0.4% | 63.5% |
| 2011[40] | 874 | 0.4% | 48.2% |
| 2012[41] | 1,382 | 0.7% | 31.9% |
| 2013[41] | 3,865 | 1.9% | 42.8% |
| 2014[42] | 9,891 | 5.0% | 54.0% |
| 2015[26] | 15,007 | 7.6% | 56.7% |
Figures include solar CSP generation, up to 2,309 GWh in 2015.
Note: Starting with 2014, the EIA began including state generation estimates for electricity produced from small-scale, distributed solar PV installations.[43] These non-utility scale estimates project that, in 2014, California generated a further 3,862 GWh of solar electricity and in 2015, California generated an additional 5,139 GWh of solar electricity from such distributed PV systems.[44]
Net metering
California has a favorable net metering law, being one of five states to receive an A in 2007, while five states received an F, in an evaluation of the 38 states plus Washington D.C. with net metering.[45] IREC best practices, based on experience, recommends no limits to net metering, individual or aggregate, and perpetual roll over of kWh credits.[46] As California was rapidly approaching the 5% aggregate limit, a May 24, 2012 ruling by the CPUC clarified the calculation of the limit, and requested a report on the cost of net metering.[47][48] California subsequently uncapped the net metering program.[49] Typically states have raised or eliminated their aggregate limits before they were reached.[50] By 2011, 16 states including California received an A for net metering.[51]
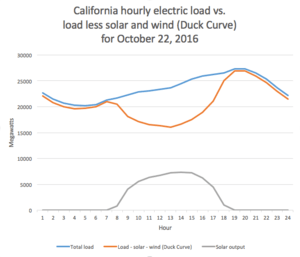
The California solar deployment has increased its duck curve (power demand for traditional power plants) to the point where large power plants are turned down to minimum during the day, while requiring large and fast power ramping by load following and peaker plants to supply peak demand in the evening when the sun has gone down. Several methods are being developed to cope with the change.[52] Time-of-use pricing is being rolled out, and has been effective in Hawaii.[53]
Permitting
California governor Jerry Brown signed a streamlined permitting bill (AB 2188) for residential solar systems on September 22, 2014. AB 2188 has four major provisions designed to reduce red-tape associated with local solar permits and requires that, by the end of September 2015, all California cities and counties must "adopt an ordinance that creates an expedited, streamlined permitting process for residential rooftop solar energy systems of less than 10 kilowatts in size."[54] Research and industry reports project the bill could reduce the cost of installing a typical residential solar system in the state by over $1,000.[55]
Alameda County
Using a 20-year property assessment known as PACE financing, Berkeley had a successful pilot program from 2008 to 2009 as the first city in the country to allow residents to obtain solar power without any initial payment. In the plan, property owners paid as much in increased property taxes as they save in energy costs, allowing them to install the panels for free at no cost to the city. Thirty eight projects are being installed for the pilot stage of the program.[56] PACE financing has spread to 28 states, but is on hold in many due to objections by Freddie Mac and Fannie Mae, including in Berkeley (which has not continued the pilot as a result). Legislation has been introduced to require acceptance of PACE financing.[57]
City of Los Angeles
The City of Los Angeles Department of Water and Power initiated a program on January 11, 2013 to pay up to 17 cents/kWh for electricity generated by up to 100 MW of solar power in a feed-in tariff program. 20 MW is reserved for small projects of less than 150 kW each. The program could be expanded to 150 MW in March.[58][59]
| Year | Available |
|---|---|
| 2013 | 40 MW |
| 2014 | 40 MW |
| 2015 | 20 MW |
| Tier | Available | Small systems | Feed in tariff |
|---|---|---|---|
| 1 | 10 MW | 2 MW | 17 cents/kWh |
| 2 | 25 MW | 5 MW | 16 cents/kWh |
| 3 | 50 MW | 10 MW | 15 cents/kWh |
| 4 | 75 MW | 15 MW | 14 cents/kWh |
| 5 | 100 MW | 20 MW | 13 cents/kWh |
New homes
In March 2013, Lancaster, California became the first U.S. city to mandate the inclusion of solar panels on new homes, requiring that "every new housing development must average 1 kilowatt per house."[60]
In May 2013, Sebastopol followed suit, requiring new buildings include either 2 W/sq ft (21.7 W/m2) of insulated building space of photovoltaics, or enough to provide 75% of the expected annual electricity use.[61]
Since January 1, 2014 California law requires all new buildings less than ten stories tall be "solar ready".[62]
In April 2016, San Francisco mandated that all new buildings less than ten stories tall include solar panels or solar water heating covering at least 15% of the roof, beginning January 1, 2017.[63]
See also
- Solar power plants in the Mojave Desert
- Solar power in the United States
- Renewable energy in the United States
- Solar Cookers International
References
- ↑ "California: Renewables Portfolio Standard". Database of State Incentives for Renewables & Efficiency. 2015-10-07. Retrieved 2015-11-01.
- ↑ "California Has More Solar Power Than You Think—a Lot More". Retrieved 14 August 2016.
- ↑ California becomes first state to generate more than 5 percent of electricity from utility-scale solar, US EIA, March 2015.
- ↑ "Major Solar Projects List: Fact Sheet". Solar Energy Industries Association (SEIA). August 15, 2014. Retrieved 2014-08-29.
- ↑ Wesoff, Eric (26 June 2015). "Solar Star, Largest PV Power Plant in the World, Now Operational". Greentech Media. Retrieved 28 July 2015.
- ↑ Evan Halper (2014-08-09). "Rules prevent solar panels in many states with abundant sunlight". Los Angeles Times. Retrieved 2014-08-30.
- ↑ Million Solar Roofs Initiative
- ↑ Sherwood, Larry (July 2014). "U.S. Solar Market Trends 2013" (PDF). Interstate Renewable Energy Council (IREC). Retrieved 2014-07-21.
- ↑ 12,000 MW of Renewable Distributed Generation by 2020
- ↑ California Solar Photovoltaic Statistics & Data retrieved 01 March 2009
- ↑ Solar Market Trends
- ↑ NREL
- ↑ Major Projects List
- ↑ Cost by Quarter
- ↑ Rooftop Solar Photovoltaic Technical Potential in the United States: A Detailed Assessment
- ↑ "PV Watts". NREL. Retrieved 11 June 2012.
- ↑ http://www.firstsolar.com/en/about-us/projects/california-flats
- ↑ "First Solar completes another half-gigawatt project in California". 15 January 2015.
- ↑ http://www.businesswire.com/news/home/20131031006341/en/NRG-Energy-NRG-Yield-SunPower-Commercial-Operations#.U29fhUks8oA
- 1 2 Bureau of Land Management (November 22, 2011). "2012 Renewable Energy Priority Projects".
- ↑ Mount Signal Solar Is Online: World's Largest Single Axis Solar PV Project, SustainableBusiness.com, 05/23/2014
- ↑ 206MW Mt. Signal Solar Farm Completed, Energy Matters, May 22, 2014
- 1 2 Todd Woody. In California’s Mojave Desert, Solar-Thermal Projects Take Off Yale Environment 360, 27 October 2010.
- ↑ "Solar energy plant in California gets new partner in NRG". Power Engineering International. PennWell Corporation. 2010-10-28. Retrieved 2010-10-29.
- ↑ Another Huge Solar Plant Goes Online in California's Desert, Chris Clarke, REWIRE, May 5, 2014
- 1 2 "Electric Power Monthly with Data for December 2015" (PDF). U.S. Energy Information Administration. February 2016. Retrieved 2015-03-09.
- ↑ K Road Gives Up on Calico Solar Project, RenewableEnergyWorld.com, James Montgomery, July 01, 2013
- ↑ Chris Meehan (Feb 20, 2012). "New survey finds most in California desert support solar". Clean Energy Authority.
- ↑ California Utilities Do Not Meet 2010 Renewable Energy Goal
- ↑ "California Solar". Retrieved 2014-11-02.
- ↑ "U.S. Wind Industry Report". American Wind Energy Association. 2014. Retrieved 2014-11-03.
- ↑ "California Eyes Euro-Style Market For Solar". Dow Jones Newswires. October 6, 2009. Archived from the original on October 10, 2009.
- ↑ The California Solar Initiative
- ↑ The eBay of Electricity
- ↑ CPUC Press Release
- ↑ California Solar Statistics Archive list
- ↑ 2016 State of the Interconnection page 10-14 + 18-23. WECC, 2016. Archive
- ↑ PVOutput
- ↑ Enphase
- 1 2 "Electric Power Monthly with Data for December 2011" (PDF). U.S. Energy Information Administration. February 2012. Retrieved 2014-07-16.
- 1 2 "Electric Power Monthly with Data for December 2013" (PDF). U.S. Energy Information Administration. February 2014. Retrieved 2014-07-16.
- ↑ "Electric Power Monthly with Data for December 2014" (PDF). U.S. Energy Information Administration. February 2015. Retrieved 2015-03-04.
- ↑ April Lee, Carolyn Moses (December 2, 2015). "EIA electricity data now include estimated small-scale solar PV capacity and generation". U.S. Energy Information Administration. Retrieved 2015-03-09.
- ↑ "Electric Power Monthly (Data for December 2015) - Table 1.17.B. Net Generation from Solar Photovoltaic". U.S. Energy Information Administration. 2016-02-26. Retrieved 2016-03-09.
- ↑ Report: States Falling Short on Interconnection and Net Metering
- ↑ Net Metering and Interconnection Procedures Incorporating Best Practices
- ↑ CPUC unanimously approves net metering expansion in California
- ↑ Decision Regarding Calculation of the Net Energy Metering Cap
- ↑ http://www.sfchronicle.com/business/article/Solar-companies-and-customers-win-big-in-6790872.php
- ↑ 2011 Updates and Trends
- ↑ Freeing the Grid
- ↑ Wirfs-Brock, Jordan (2014-10-02). "IE Questions: Why Is California Trying To Behead The Duck?". Inside Energy. Retrieved 2016-10-29.
- ↑ Lazar, Jim (8 August 2016). "The Duck is learning to fly in California and Hawaii". Utility Dive. Retrieved 29 October 2016.
- ↑ Eric Wesoff (2014-09-22). "New California Law Cuts Solar-Permitting Red Tape". GreenTech Media. Retrieved 2014-09-23.
- ↑ Chad Garland (2014-08-23). "Assembly bill could lower cost of residential solar in California". The Los Angeles Times. Retrieved 2014-09-23.
- ↑ Berkeley FIRST retrieved 4 February 2009
- ↑ Property Assessed Clean Energy Financing (PACE)
- ↑ Los Angeles DWP unveils solar power buyback program
- ↑ Solar Feed-in Tariff (FiT) Program
- ↑ "Lancaster, CA, Becomes First US City to Require Solar". Greentech Media. March 27, 2013.
- ↑ California town of Sebastopol will require solar panels on all new homes
- ↑ California poised to require 'solar ready roofs' on new homes and buildings
- ↑ San Francisco Becomes First Major U.S. City To Mandate Rooftop Solar In New Buildings
External links
| Wikimedia Commons has media related to Solar power in California. |
- Go Solar California
- California Energy Commission
- California Solar Energy Industries Association
- Northern California Solar Energy Association
- Solar California
- Renewables Portfolio Standard
- California's Renewable Energy Law Lives!
- Clean Power Estimator (California only)
- California daily hourly power production
- Google Map of Operating and Under Construction California Utility Scale PV
Sacramento (capital) | ||
| Topics |  | |
| Regions |
| |
| Metro regions | ||
| Counties |
| |
| Most populous cities | ||