Stourbridge (UK Parliament constituency)
| Stourbridge | |
|---|---|
|
Borough constituency for the House of Commons | |
|
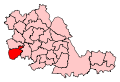
Boundary of Stourbridge in West Midlands. | |
|
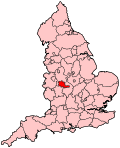
Location of West Midlands within England. | |
| County | West Midlands |
| Electorate | 70,225 (December 2010)[1] |
| Major settlements | Amblecote, Cradley, Lye, Quarry Bank, Stourbridge |
| Current constituency | |
| Created | 1997 |
| Member of parliament | Margot James (Conservative) |
| Number of members | One |
| Created from | Halesowen & Stourbridge |
| 1918–1950 | |
| Number of members | One |
| Type of constituency | Borough constituency |
| Replaced by | Oldbury and Halesowen and part-incorporated into Dudley. |
| Created from | North Worcestershire |
| Overlaps | |
| European Parliament constituency | West Midlands |
Stourbridge is a constituency[n 1] represented in the House of Commons of the UK Parliament since 2010 by Margot James, a Conservative.[n 2]
Boundaries
1997-2010: The Metropolitan Borough of Dudley wards of Amblecote, Lye and Wollescote, Norton, Pedmore and Stourbridge East, Quarry Bank and Cradley, and Wollaston and Stourbridge West.
2010-present: The Metropolitan Borough of Dudley wards of Amblecote, Cradley and Foxcote, Lye and Wollescote, Norton, Pedmore and Stourbridge East, Quarry Bank and Dudley Wood, and Wollaston and Stourbridge Town.
Stourbridge is one of four constituencies in the Metropolitan Borough of Dudley, covering the south-west of the borough.
History
- 1918-1950
During this period no ministerial roles happened to have been awarded to any of the members. Prominent members in social history include: Wilfred Wellock, who wrote 13 publications, and was an early Gandhian as well as a promoter of increased localism. At the end of this period, Lord Moyle (as he became) went on to serve Oldbury and Halesowen until 1964 and in the ballot for Private member's bills achieved three to legislate in respect of:
- Humane Slaughter of Horses
- Air Pollution
- Children of the divorced (custody etc.) as recommended by the Royal Commission
The constituency was abolished in 1950, with the Stourbridge West and Stourbridge East wards being incorporated into the Dudley constituency. An Eastern section of the old constituency was included in the new Oldbury and Halesowen seat.
- 1997-date
Before recreation, in 1997, the seat's forerunner, Halesowen and Stourbridge, created in 1974, was held by a Conservative and both of its replacements, including this seat, were taken by Labour in 1997. The smaller remainder of the predecessor forms part of Halesowen and Rowley Regis.
Labour retained the seat by just above a marginal majority at the general election in 2001, and retained it again in 2005, with a new candidate, Lynda Waltho, with a marginal majority of 1% of the vote.
The Tories regained the seat at the 2010 election, via their candidate winning, Margot James.
Constituency profile
Much of the town consists of suburban streets, interspersed with green spaces, with the other settlements being contiguous. Stourbridge borders on green belt land, and is close to unspoiled countryside with rural Shropshire close by to the west. The Clent Hills, Kinver Edge and large areas of farmland lie to the south and west.
Workless claimants, registered jobseekers, were in November 2012 higher than the national average of 3.8%, at 4.8% of the population based on a statistical compilation by The Guardian.[2]
Members of Parliament
MPs 1918–1950
| Election | Member[3] | Party | |
|---|---|---|---|
| 1918 | John William Wilson | Liberal | |
| 1922 | Douglas Percival Pielou | Conservative | |
| 1927 by-election | Wilfred Wellock | Labour | |
| 1931 | Robert Harry Morgan | Conservative | |
| 1945 | Arthur Moyle | Labour | |
| 1950 | constituency abolished | ||
MPs since 1997
| Election | Member[3] | Party | |
|---|---|---|---|
| 1997 | Debra Shipley | Labour | |
| 2005 | Lynda Waltho | Labour | |
| 2010 | Margot James | Conservative | |
Elections
Elections in the 2010s
| Party | Candidate | Votes | % | ± | |
|---|---|---|---|---|---|
| Conservative | Margot James | 21,195 | 46.0 | +3.4 | |
| Labour | Pete Lowe | 14,501 | 31.5 | -0.2 | |
| UKIP | James Carver | 7,774 | 16.9 | +12.4 | |
| Liberal Democrat | Chris Bramall | 1,538 | 3.3 | -13.0 | |
| Green | Christian Kiever[5] | 1,021 | 2.2 | +1.4 | |
| Majority | 6,694 | 14.5 | |||
| Conservative hold | Swing | ||||
| Party | Candidate | Votes | % | ± | |
|---|---|---|---|---|---|
| Conservative | Margot James | 20,153 | 42.7 | +3.4 | |
| Labour | Lynda Waltho | 14,989 | 31.7 | -10.4 | |
| Liberal Democrat | Chris Bramall | 7,733 | 16.4 | +0.4 | |
| UKIP | Maddy Westrop | 2,103 | 4.5 | +1.8 | |
| BNP | Robert Weale | 1,696 | 3.6 | +3.6 | |
| Green | Will Duckworth | 394 | 0.8 | +0.8 | |
| Independent | Alun Nicholas | 166 | 0.4 | +0.4 | |
| Majority | 5,164 | 10.9 | |||
| Turnout | 47,234 | 67.8 | +3.9 | ||
| Conservative gain from Labour | Swing | +6.9 | |||
Elections in the 2000s
| Party | Candidate | Votes | % | ± | |
|---|---|---|---|---|---|
| Labour | Lynda Waltho | 17,089 | 41.0 | −6.1 | |
| Conservative | Diana Coad | 16,682 | 40.0 | +2.4 | |
| Liberal Democrat | Chris Bramall | 6,850 | 16.4 | +4.3 | |
| UKIP | Daniel Pui Chai Mau | 1,087 | 2.6 | +0.7 | |
| Majority | 407 | 1.0 | |||
| Turnout | 41,708 | 64.7 | +2.9 | ||
| Labour hold | Swing | −4.3 | |||
| Party | Candidate | Votes | % | ± | |
|---|---|---|---|---|---|
| Labour | Debra Shipley | 18,823 | 47.1 | -0.1 | |
| Conservative | Stephen Eyre | 15,011 | 37.6 | +1.8 | |
| Liberal Democrat | Chris Bramall | 4,833 | 12.1 | -2.2 | |
| UKIP | John Knotts | 763 | 1.9 | N/A | |
| Socialist Labour | Mick Atherton | 494 | 1.2 | N/A | |
| Majority | 3,812 | 9.5 | |||
| Turnout | 39,924 | 61.8 | -14.7 | ||
| Labour hold | Swing | ||||
Elections in the 1990s
| Party | Candidate | Votes | % | ± | |
|---|---|---|---|---|---|
| Labour | Debra Shipley | 23,452 | 47.2 | +8.9 | |
| Conservative | Warren Hawksley | 17,807 | 35.8 | -13.0 | |
| Liberal Democrat | Chris Bramall | 7,123 | 14.3 | +2.5 | |
| Referendum | Peter Quick | 1,319 | 2.7 | N/A | |
| Majority | 5,645 | 11.4 | N/A | ||
| Turnout | 76.5 | N/A | |||
| Labour gain from Conservative | Swing | N/A | |||
Elections in the 1940s
| Party | Candidate | Votes | % | ± | |
|---|---|---|---|---|---|
| Labour | Arthur Moyle | 34,912 | 48.5 | +14.2 | |
| Conservative | Robert Harry Morgan | 18,979 | 26.3 | -17.2 | |
| Liberal | Col. Ralph Kilner Brown | 18,159 | 25.2 | +3.0 | |
| Majority | 15,933 | 22.1 | |||
| Turnout | 74.2 | ||||
| Labour gain from Conservative | Swing | ||||
General Election 1939/40: Another general election was required to take place before the end of 1940. The political parties had been making preparations for an election to take place from 1939 and by the end of this year, the following candidates had been selected;
- Conservative: Robert Morgan
- Liberal: Ralph Brown[11]
- Labour: Wilfred Wellock[12]
Elections in the 1930s
| Party | Candidate | Votes | % | ± | |
|---|---|---|---|---|---|
| Conservative | Robert Harry Morgan | 24,898 | 43.5 | +4.2 | |
| Labour | Wilfred Wellock | 19,597 | 34.3 | +1.5 | |
| Liberal | Donald Leslie Finnemore | 12,864 | 22.2 | -5.8 | |
| Majority | 5,301 | 9.3 | +2.8 | ||
| Turnout | 57,179 | 70.9 | -11.1 | ||
| Conservative hold | Swing | ||||
| Party | Candidate | Votes | % | ± | |
|---|---|---|---|---|---|
| Conservative | Robert Harry Morgan | 22,652 | 39.3 | +7.5 | |
| Labour | Wilfred Wellock | 18,910 | 32.8 | -5.6 | |
| Liberal | Donald Leslie Finnemore | 16,121 | 28.0 | -1.8 | |
| Majority | 3,742 | 6.5 | 13.1 | ||
| Turnout | 57,683 | 82.0 | |||
| Conservative gain from Labour | Swing | +6.5 | |||
Elections in the 1920s
| Party | Candidate | Votes | % | ± | |
|---|---|---|---|---|---|
| Labour | Wilfred Wellock | 21,343 | 38.4 | -3.5 | |
| Unionist | Sir Herbert Stanley Reed | 17,675 | 31.8 | -2.2 | |
| Liberal | Donald Leslie Finnemore | 16,537 | 29.8 | +5.7 | |
| Majority | 3,668 | 6.6 | |||
| Turnout | |||||
| Labour hold | Swing | ||||
| Party | Candidate | Votes | % | ± | |
|---|---|---|---|---|---|
| Labour | Wilfred Wellock | 16,561 | 41.9 | +7.1 | |
| Unionist | Henry Cairn Hogbin | 13,462 | 34.0 | -5.5 | |
| Liberal | Aneurin John Glyn Edwards | 9,535 | 24.1 | -1.6 | |
| Majority | 3,099 | ||||
| Turnout | |||||
| Labour gain from Unionist | Swing | ||||
| Party | Candidate | Votes | % | ± | |
|---|---|---|---|---|---|
| Unionist | Douglas Percival Pielou | 16,023 | 39.5 | ||
| Labour | Wilfred Wellock | 14,113 | 34.8 | ||
| Liberal | Geoffrey Le Measurer Mander | 10,418 | 25.7 | ||
| Majority | 1,910 | ||||
| Turnout | |||||
| Unionist hold | Swing | ||||
| Party | Candidate | Votes | % | ± | |
|---|---|---|---|---|---|
| Unionist | Douglas Percival Pielou | 14,764 | 39.8 | ||
| Liberal | Harry Evers Palfrey | 13,269 | 35.8 | ||
| Labour | Wilfred Wellock | 9,050 | 24.4 | n/a | |
| Majority | 1,495 | 4.0 | |||
| Turnout | 37,083 | ||||
| Unionist hold | Swing | ||||
| Party | Candidate | Votes | % | ± | |
|---|---|---|---|---|---|
| Unionist | Douglas Percival Pielou | 18,200 | 51.8 | n/a | |
| Liberal | Rt Hon. John William Wilson | 16,949 | 48.2 | +9.7 | |
| Majority | 1,251 | 3.6 | |||
| Turnout | 35,149 | ||||
| Unionist gain from Liberal | Swing | n/a | |||
Elections in the 1910s
| Party | Candidate | Votes | % | ± | |
|---|---|---|---|---|---|
| Liberal | Rt Hon. John William Wilson | 8,920 | 38.5 | n/a | |
| Labour | Mary Reid Anderson | 7,587 | 32.7 | n/a | |
| National Democratic | Frederick Victor Fisher | 6,690 | 28.8 | n/a | |
| Majority | 1,333 | 5.8 | n/a | ||
| Turnout | 23,197 | n/a | |||
| Liberal win (new seat) | |||||
- denotes candidate who was endorsed by the Coalition Government.
See also
Notes and references
- Notes
- ↑ A borough constituency (for the purposes of election expenses and type of returning officer)
- ↑ As with all constituencies, the constituency elects one Member of Parliament (MP) by the first past the post system of election at least every five years.
- References
- ↑ "Electorate Figures - Boundary Commission for England". 2011 Electorate Figures. Boundary Commission for England. 4 March 2011. Retrieved 13 March 2011.
- ↑ Unemployment claimants by constituency The Guardian
- 1 2 Leigh Rayment's Historical List of MPs – Constituencies beginning with "S" (part 5)
- ↑ "Election Data 2015". Electoral Calculus. Archived from the original on 17 October 2015. Retrieved 17 October 2015.
- ↑ https://my.greenparty.org.uk/candidates/106230
- ↑ "Election Data 2010". Electoral Calculus. Archived from the original on 17 October 2015. Retrieved 17 October 2015.
- ↑ "Election Data 2005". Electoral Calculus. Archived from the original on 15 October 2011. Retrieved 18 October 2015.
- ↑ "Election Data 2001". Electoral Calculus. Archived from the original on 15 October 2011. Retrieved 18 October 2015.
- ↑ "Election Data 1997". Electoral Calculus. Archived from the original on 15 October 2011. Retrieved 18 October 2015.
- ↑ Craig, F. W. S. (1983). British parliamentary election results 1918-1949 (3 ed.). Chichester: Parliamentary Research Services. ISBN 0-900178-06-X.
- ↑ The Liberal Magazine, 1939
- ↑ Report of the Annual Conference of the Labour Party, 1939
- ↑ Craig, F. W. S. (1983). British parliamentary election results 1918-1949 (3 ed.). Chichester: Parliamentary Research Services. ISBN 0-900178-06-X.
- ↑ Craig, F. W. S. (1983). British parliamentary election results 1918-1949 (3 ed.). Chichester: Parliamentary Research Services. ISBN 0-900178-06-X.
- ↑ British parliamentary election results 1918-1949, Craig, F.W.S.
- ↑ British parliamentary election results 1918-1949, Craig, F.W.S.
- ↑ British parliamentary election results 1918-1949, Craig, F.W.S.
- ↑ Craig, F. W. S. (1983). British parliamentary election results 1918-1949 (3 ed.). Chichester: Parliamentary Research Services. ISBN 0-900178-06-X.
- ↑ Craig, F. W. S. (1983). British parliamentary election results 1918-1949 (3 ed.). Chichester: Parliamentary Research Services. ISBN 0-900178-06-X.
Sources
- Craig, F. W. S. (1983) [1969]. British parliamentary election results 1918–1949 (3rd ed.). Chichester: Parliamentary Research Services. p. 503. ISBN 0-900178-06-X.
Coordinates: 52°27′N 2°08′W / 52.45°N 2.13°W