North Warwickshire (UK Parliament constituency)
| North Warwickshire | |
|---|---|
|
County constituency for the House of Commons | |
|
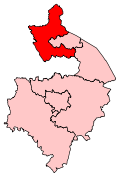
Boundary of North Warwickshire in Warwickshire. | |
|
Location of Warwickshire within England. | |
| County | Warwickshire |
| Electorate | 70,544 (December 2010)[1] |
| Major settlements | Atherstone, Bedworth, Coleshill and Polesworth |
| Current constituency | |
| Created | 1983 |
| Member of parliament | Craig Tracey (Conservative) |
| Number of members | One |
| Created from |
Meriden Nuneaton |
| 1832–1885 | |
| Number of members | Two |
| Type of constituency | County constituency |
| Replaced by |
Nuneaton Rugby Stratford-on-Avon Tamworth |
| Created from | Warwickshire |
| Overlaps | |
| European Parliament constituency | West Midlands |

North Warwickshire is a constituency[n 1] represented in the House of Commons of the UK Parliament since 2015 by Craig Tracey, a Conservative.[n 2]
Boundaries
1983-2010: The Borough of North Warwickshire, and the Borough of Nuneaton and Bedworth wards of Exhall, Heath, Mount Pleasant, and Poplar.
2010-present: The Borough of North Warwickshire wards of Atherstone Central, Atherstone North, Atherstone South and Mancetter, Baddesley and Grendon, Coleshill North, Coleshill South, Curdworth, Dordon, Fillongley, Hurley and Wood End, Kingsbury, Newton Regis and Warton, Polesworth East, Polesworth West, and Water Orton, and the Borough of Nuneaton and Bedworth wards of Bede, Exhall, Heath, Poplar, and Slough.
The constituency since 2010 has all but two wards of North Warwickshire.[n 3]
History
History 1832–1885
The North Warwickshire constituency was created for the 1832 general election, when the Great Reform Act divided the former Warwickshire constituency into two new divisions: North Warwickshire and South Warwickshire.
Under the Redistribution of Seats Act 1885, North Warwickshire was abolished for the 1885 general election, when Warwickshire was divided into four new single-member constituencies: Nuneaton, Rugby, Stratford-on-Avon and Tamworth.
History 1983–present
The current North Warwickshire county constituency was created for the 1983 general election, replacing outlying parts of the Meriden and Nuneaton constituencies. The seat was won by Francis Maude of the Conservative Party at the 1983 general election, who held it until 1992, when it was taken by Mike O'Brien of Labour. Labour held the seat comfortably until 2010.
On 8 March 2007, former Army Officer and polar explorer Dan Byles was selected at an open primary to contest North Warwickshire for the Conservative Party. At the 2010 general election, Byles won the seat off Mike O'Brien by just 54 votes, making him the Conservative Member of Parliament with the smallest majority in the country.
Constituency profile
Warwickshire North has wards which are the most "working-class" (lowest average income) and industrial of the six constituencies in the county, politically frequently with the best returns locally for Labour candidates. In the 2010 election all six Warwickshire constituencies were won by the Conservative party, this constituency was the most marginal, falling on a substantial swing of 8.1% from Labour to the Conservatives (compared to a national swing of 5%).
Like much of the county, the area includes many rural villages which can today be classified as 'commuter' and 'retirement' south of the National Forest, south east of Tamworth and the small cathedral city of Lichfield and centred less than 10 miles (16 km) east of Birmingham which provides some work locally in the creative and international export sectors. Many towns and villages have a history of coal mining and heavy industry and with that a strong Labour vote.[2]
Settlements include Bedworth, just north of Coventry, and the historic market town of Atherstone.[n 4]
Members of Parliament
MPs 1832–1885
| Election | 1st Member[3] | 1st Party | 2nd Member[3] | 2nd Party | ||
|---|---|---|---|---|---|---|
| 1832 | William Stratford Dugdale | Conservative | Sir John Eardley-Wilmot, Bt | Conservative | ||
| 1843 by-election | Charles Newdigate Newdegate | Conservative | ||||
| 1847 | Richard Spooner | Conservative | ||||
| 1864 by-election | William Bromley-Davenport | Conservative | ||||
| 1884 by-election | Philip Muntz | Conservative | ||||
| 1885 | Constituency abolished: see Nuneaton, Rugby, Stratford-on-Avon and Tamworth | |||||
MPs since 1983
| Election | Member[3] | Party | |
|---|---|---|---|
| 1983 | Francis Maude | Conservative | |
| 1992 | Mike O'Brien | Labour | |
| 2010 | Dan Byles | Conservative | |
| 2015 | Craig Tracey | Conservative | |
Elections
Elections in the 2010s
| Party | Candidate | Votes | % | ± | |
|---|---|---|---|---|---|
| Conservative | Craig Tracey | 20,042 | 42.3 | +2.1 | |
| Labour | Mike O'Brien | 17,069 | 36.0 | -4.0 | |
| UKIP | William Cash[5] | 8,256 | 17.4 | +14.6 | |
| Liberal Democrat | Alan Beddow | 978 | 2.1 | -9.8 | |
| Green | Ian Bonner | 894 | 1.9 | N/A | |
| TUSC | Eileen Hunter | 138 | 0.3 | N/A | |
| Majority | 2,973 | 6.3 | +6.2 | ||
| Turnout | 47,377 | 67.2 | -0.2 | ||
| Conservative hold | Swing | +3.05 | |||
| Party | Candidate | Votes | % | ± | |
|---|---|---|---|---|---|
| Conservative | Daniel Byles | 18,993 | 40.2 | +8.2 | |
| Labour | Mike O'Brien | 18,939 | 40.1 | -8.0 | |
| Liberal Democrat | Stephen Martin | 5,481 | 11.6 | -1.9 | |
| BNP | Jason Holmes | 2,106 | 4.5 | +0.4 | |
| UKIP | Stephen Fowler | 1,335 | 2.8 | +0.1 | |
| English Democrat | David Lane | 411 | 0.9 | N/A | |
| Majority | 54 | 0.1 | N/A | ||
| Turnout | 47,265 | 67.4 | +5.2 | ||
| Conservative gain from Labour | Swing | +8.1 | |||
Elections in the 2000s
| Party | Candidate | Votes | % | ± | |
|---|---|---|---|---|---|
| Labour | Mike O'Brien | 22,561 | 48.1 | -6.0 | |
| Conservative | Ian Gibb | 15,008 | 32.0 | -0.4 | |
| Liberal Democrat | Jerry Roodhouse | 6,212 | 13.2 | +1.8 | |
| BNP | Michaela Mackenzie | 1,910 | 4.1 | N/A | |
| UKIP | Ian Campbell | 1,248 | 2.7 | +0.6 | |
| Majority | 7,553 | 16.1 | -5.6 | ||
| Turnout | 46,939 | 62.2 | +2.0 | ||
| Labour hold | Swing | -2.8 | |||
| Party | Candidate | Votes | % | ± | |
|---|---|---|---|---|---|
| Labour | Mike O'Brien | 24,023 | 54.1 | -4.3 | |
| Conservative | Geoffrey Parsons | 14,384 | 32.4 | +1.2 | |
| Liberal Democrat | William Powell | 5,052 | 11.4 | +4.0 | |
| UKIP | John Flynn | 950 | 2.1 | +1.1 | |
| Majority | 9,639 | 21.7 | -5.5 | ||
| Turnout | 44,409 | 60.2 | -14.6 | ||
| Labour hold | Swing | -2.75 | |||
Elections in the 1990s
| Party | Candidate | Votes | % | ± | |
|---|---|---|---|---|---|
| Labour | Mike O'Brien | 31,669 | 58.4 | +12.3 | |
| Conservative | Stephen Hammond | 16,902 | 31.2 | -13.4 | |
| Liberal Democrat | William Powell | 4,040 | 7.4 | -2.9 | |
| Referendum | Roland Mole | 917 | 1.7 | N/A | |
| UKIP | Christopher Cooke | 533 | 1.0 | N/A | |
| Berties Party | Ian Moorecroft | 178 | 0.3 | N/A | |
| Majority | 14,767 | 27.2 | +24.8 | ||
| Turnout | 54,239 | 74.7 | -8.1 | ||
| Labour hold | Swing | +12.85 | |||
| Party | Candidate | Votes | % | ± | |
|---|---|---|---|---|---|
| Labour | Mike O'Brien | 27,577 | 46.1 | +6.0 | |
| Conservative | Francis Maude | 26,124 | 43.6 | -1.4 | |
| Liberal Democrat | Noel R Mitchell | 6,161 | 10.3 | N/A | |
| Majority | 1,453 | 2.4 | N/A | ||
| Turnout | 59,862 | 82.8 | +4.0 | ||
| Labour gain from Conservative | Swing | +3.7 | |||
Elections in the 1980s
| Party | Candidate | Votes | % | ± | |
|---|---|---|---|---|---|
| Conservative | Francis Maude | 25,453 | 45.08 | +3.13 | |
| Labour | Mike O'Brien | 22,624 | 40.07 | +2.95 | |
| Social Democratic | SJ Neale | 8,382 | 14.85 | -6.09 | |
| Majority | 2,829 | 5.01 | +0.18 | ||
| Turnout | 56,459 | 79.87 | -1.87 | ||
| Conservative hold | Swing | +0.09 | |||
| Party | Candidate | Votes | % | ± | |
|---|---|---|---|---|---|
| Conservative | Francis Maude | 22,452 | 41.95 | N/A | |
| Labour | JE Tomlinson | 19,867 | 37.12 | N/A | |
| Social Democratic | H Kerry | 11,207 | 20.94 | N/A | |
| Majority | 2,585 | 4.83 | N/A | ||
| Turnout | 53,526 | 78.00 | N/A | ||
| Conservative win (new seat) | |||||
See also
Notes
- ↑ A county constituency (for the purposes of election expenses and type of returning officer)
- ↑ As with all constituencies, the constituency elects one Member of Parliament (MP) by the first past the post system of election at least every five years.
- ↑ Arley and Whitacre and Hartshill, moved in 2010 to Nuneaton
- ↑ This saw considerable population expansion from 1995-2010
References
- ↑ "Electorate Figures - Boundary Commission for England". 2011 Electorate Figures. Boundary Commission for England. 4 March 2011. Retrieved 13 March 2011.
- ↑ "2011 Census Interactive - ONS". ons.gov.uk.
- 1 2 3 Leigh Rayment's Historical List of MPs – Constituencies beginning with "W" (part 1)
- ↑ "Election Data 2015". Electoral Calculus. Archived from the original on 17 October 2015. Retrieved 17 October 2015.
- ↑ http://ukpollingreport.co.uk/2015guide/warwickshirenorth/
- ↑ "Election Data 2010". Electoral Calculus. Archived from the original on 26 July 2013. Retrieved 17 October 2015.
- ↑ "UK > England > West Midlands > Warwickshire North". Election 2010. BBC. 7 May 2010. Retrieved 10 May 2010.
- ↑ "Election Data 2005". Electoral Calculus. Archived from the original on 15 October 2011. Retrieved 18 October 2015.
- ↑ "Election Data 2001". Electoral Calculus. Archived from the original on 15 October 2011. Retrieved 18 October 2015.
- ↑ "Election Data 1997". Electoral Calculus. Archived from the original on 15 October 2011. Retrieved 18 October 2015.
- ↑ "'Warwickshire North', May 1997 -". ElectionWeb Project. Cognitive Computing Limited. Retrieved 18 May 2016.
- ↑ "Election Data 1992". Electoral Calculus. Archived from the original on 15 October 2011. Retrieved 18 October 2015.
- ↑ "UK General Election results April 1992". Richard Kimber's Political Science Resources. Politics Resources. 9 April 1992. Retrieved 6 December 2010.
- ↑ "Election Data 1987". Electoral Calculus. Archived from the original on 15 October 2011. Retrieved 18 October 2015.
- ↑ "Election Data 1983". Electoral Calculus. Archived from the original on 15 October 2011. Retrieved 18 October 2015.
Coordinates: 52°30′N 1°42′W / 52.50°N 1.70°W