Birmingham Edgbaston (UK Parliament constituency)
Coordinates: 52°27′N 1°54′W / 52.450°N 1.900°W
| Birmingham Edgbaston | |
|---|---|
|
Borough constituency for the House of Commons | |
|
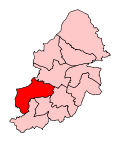
Boundary of Birmingham Edgbaston in Birmingham. | |
|
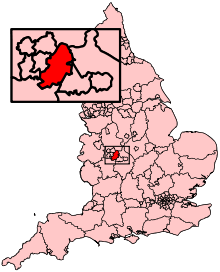
Location of Birmingham within England. | |
| County | West Midlands |
| Population | 96,568 (2011 census)[1] |
| Electorate | 69,039 (December 2010)[2] |
| Current constituency | |
| Created | 1885 |
| Member of parliament | Gisela Stuart (Labour) |
| Number of members | One |
| Created from | Birmingham |
| Overlaps | |
| European Parliament constituency | West Midlands |
Birmingham, Edgbaston is a constituency[n 1] in the Edgbaston area of Birmingham represented in the House of Commons of the UK Parliament since 1997 by Gisela Stuart MP of the Labour Party.[n 2]
Its best-known MP internationally was Neville Chamberlain (Prime Minister 1937-1940), and since 1953 it has been represented only by women MPs. Since 1992 it has been a marginal constituency between the Labour Party and the Conservative Party.
Boundaries
1885-1918: The Municipal Borough of Birmingham ward of Edgbaston, part of Rotton Park ward, the local government district of Harborne, and part of the local government district of Balsall Heath.
1918-1974: The County Borough of Birmingham wards of Edgbaston, Harborne, and Market Hall.
1974-1983: The County Borough of Birmingham wards of Deritend, Edgbaston, Harborne, and Quinton.
1983-1997: The City of Birmingham wards of Edgbaston, Harborne, and Quinton.
1997–present: The City of Birmingham wards of Bartley Green, Edgbaston, Harborne, and Quinton.
Situated to the south west of Birmingham city centre, this is a neat and mostly middle-class constituency with limited social housing, with parks, Warwickshire's cricket ground and two grammar schools. It was a safe Conservative seat for decades, emphasised by solid Tory areas like Edgbaston itself and Bartley Green, but some areas, such as the more Labour-inclined Quinton and Harborne, have pockets of considerable deprivation and of low incomes, helping Labour hold the seat since 1997. It contains the University of Birmingham's main campus, and most of the student halls.
History
The seat was held by the Conservatives until the 1997 Election. At that election it was the ninth seat to declare and the first seat to be gained by Labour from the Conservatives[3] on a 10% swing, presaging the Labour landslide of that year.
Edgbaston has returned a female MP since 1953, longer than any other constituency.[4] The sitting MP is Gisela Stuart. It has been classified as a marginal seat.[5]
Members of Parliament
| Election | Member[6] | Party | Notes | |
|---|---|---|---|---|
| 1885 | George Dixon | Liberal | ||
| 1886 | Liberal Unionist | |||
| 1898 by-election | Francis Lowe | Conservative | ||
| 1929 | Rt Hon Neville Chamberlain | Conservative | Prime Minister 1937-1940; died 1940 | |
| 1940 by-election | Peter Bennett | Conservative | Resigned 1953 on being raised to the peerage | |
| 1953 by-election | Dame Edith Pitt | Conservative | Died January 1966; no by-election held due to imminent general election | |
| 1966 | Dame Jill Knight | Conservative | ||
| 1997 | Gisela Stuart | Labour | ||
Election results 1931-2015
| Election | Political result | Candidate | Party | Votes | % | ±% | ||
|---|---|---|---|---|---|---|---|---|
| General Election 2015 [7] Electorate: 65,544 Turnout: 41,293 (63.0%) +2.3 | Labour hold Majority: 2,706 (6.6%) +3.5 Swing: 1.8% from Con to Lab | Gisela Stuart | Labour | 18,518 | 44.8 | +4.2 | ||
| Luke Evans[8] | Conservative | 15,812 | 38.3 | +0.7 | ||||
| Graham Short[9] | UKIP | 4,154 | 10.1 | +8.3 | ||||
| Philip McDonald Simpson | Green | 1,371 | 3.3 | +2.2 | ||||
| Lee Dargue[8] | Liberal Democrat | 1,184 | 2.9 | −12.5 | ||||
| Gabriel Ukandu | Christian | 163 | 0.4 | +0.1 | ||||
| Henna Rai | Independent | 91 | 0.2 | N/A | ||||
| General Election 2010 [10] Electorate: 69,039 Turnout: 41,571 (60.6%) +3.3 | Labour hold Majority: 1,274 (3.1%) −3.1 Swing: 1.3% from Lab to Con | Gisela Stuart | Labour | 16,894 | 40.6 | −2.5 | ||
| Deirdre Alden | Conservative | 15,620 | 37.6 | +0.1 | ||||
| Roger Harmer | Liberal Democrat | 6,387 | 15.4 | +2.6 | ||||
| Trevor Lloyd | BNP | 1,196 | 2.9 | N/A | ||||
| Stephen White | UKIP | 732 | 1.8 | −0.4 | ||||
| Philip McDonald Simpson | Green | 469 | 1.1 | −1.7 | ||||
| Harry Takhar | Impact Party | 146 | 0.4 | N/A | ||||
| Charith Fernando | Christian | 127 | 0.3 | N/A | ||||
| General Election 2005 [11] Turnout: 37,631 (58.0%) +2.0 | Labour hold Majority: 2,349 (6.2%) −6.2 Swing: 1.3% from Lab to Con | Gisela Stuart | Labour | 16,465 | 43.8 | −5.3 | ||
| Deirdre Alden | Conservative | 14,116 | 37.5 | +0.9 | ||||
| Mike D. Dixon | Liberal Democrat | 5,185 | 13.8 | +1.8 | ||||
| Peter C. Beck | Green | 1,116 | 3.0 | N/A | ||||
| Stephen White | UKIP | 749 | 2.0 | N/A | ||||
| General Election 2001 [12] Turnout: 37,749 (56.0%) −13.0 | Labour hold Majority: 4,698 (12.4%) +2.4 Swing: 0.8% from Lab to Con | Gisela Stuart | Labour | 18,517 | 49.1 | +0.5 | ||
| Nigel Hastilow | Conservative | 13,819 | 36.6 | −2.0 | ||||
| Nicola Davies | Liberal Democrat | 4,528 | 12.0 | +2.3 | ||||
| Collis Gretton | Pro-Euro Conservative | 454 | 1.2 | N/A | ||||
| Sam Brackenbury | Socialist Labour | 431 | 1.1 | N/A | ||||
| General Election 1997 [13] Turnout: 48,465 (69.0%) −2.3 | Labour gain from Conservative Majority: 4,842 (10.0%) N/A Swing: 10.0% from Con to Lab | Gisela Stuart | Labour | 23,554 | 48.6 | +9.3 | ||
| Andrew Marshall | Conservative | 18,712 | 38.6 | −10.7 | ||||
| James Young Gallagher | Liberal Democrat | 4,691 | 9.7 | −0.4 | ||||
| Jonathan Paul Oakton | Referendum | 1,065 | 2.2 | N/A | ||||
| Derek Lawrence Campbell | British Democratic Party | 443 | 0.9 | N/A | ||||
| General Election 1992 [14] Turnout: 37,813 (71.3%) +2.7 | Conservative hold Majority: 4,307 (11.4%) −11.6 Swing: 5.8% from Con to Lab | Dame Jill Knight | Conservative | 18,529 | 49.0 | −0.8 | ||
| John Federick Wilton | Labour | 14,222 | 37.6 | +10.8 | ||||
| Dr. Iain R.S. Robertson-Steel | Liberal Democrat | 4,419 | 11.7 | −9.3 | ||||
| Philip McDonald Simpson | Green | 643 | 1.7 | +0.2 | ||||
| General Election 1987 [15] Turnout: 37,318 (68.6%) +2.4 | Conservative hold Majority: 8,581 (22.9%) −8.4 | Dame Jill Knight | Conservative | 18,595 | 49.8 | −3.9 | ||
| John Federick Wilton | Labour | 10,014 | 26.9 | +5.9 | ||||
| Joseph Christopher Binns | Social Democratic | 7,843 | 21.0 | −1.4 | ||||
| Philip McDonald Simpson | Green | 559 | 1.5 | N/A | ||||
| Stephen Thomas Hardwick | Independent Conservative | 307 | 0.8 | −0.0 | ||||
| General Election 1983 [16] Turnout: 36,546 (66.2%) −1.6 | Conservative hold Majority: 11,418 (31.3%) +10.7 | Dame Jill Knight | Conservative | 19,585 | 53.7 | −0.4 | ||
| Joseph Christopher Binns | Social Democratic | 8,167 | 22.4 | N/A | ||||
| Peter Alan Bilson | Labour | 7,647 | 21.0 | −12.5 | ||||
| Dr. John Hurdley | Ecology | 516 | 1.4 | −0.4 | ||||
| Stephen Thomas Hardwick | Independent Conservative | 293 | 0.8 | N/A | ||||
| Patricia Ann Davies | Communist | 169 | 0.4 | N/A | ||||
| Daphne Constance Howlett | Independent | 97 | 0.3 | N/A | ||||
| General Election 1979 Turnout: 46,564 (67.8%) | Conservative hold Majority: 9,587 (20.6%) | Dame Jill Knight | Conservative | 25,192 | 54.1 | |||
| Andrew Hudson | Labour | 15,605 | 33.5 | |||||
| James Dugued | Liberal | 4,377 | 9.4 | |||||
| Jonathan Tyler | Ecology | 852 | 1.8 | |||||
| Daphne Howlett | Independent | 297 | 0.6 | |||||
| Brian Dore | Independent | 129 | 0.3 | |||||
| Leonard Marshall | Independent | 112 | 0.2 | |||||
| General Election October 1974 Turnout: 63.25% | Conservative hold Majority: 2,410 (5.44%) | Dame Jill Knight | Conservative | 19,483 | 43.95 | |||
| John Hannah | Labour | 17,073 | 38.52 | |||||
| Peter Davis | Liberal | 7,770 | 17.53 | |||||
| General Election February 1974 Turnout: 69.36% | Conservative hold Majority: 5,920 (12.26%) | Dame Jill Knight | Conservative | 25,914 | 53.65 | |||
| John Hannah | Labour | 19,994 | 41.40 | |||||
| Leonard Marshall | Independent | 2,391 | 4.95 | |||||
| General Election 1970 Turnout: 63.64% | Conservative hold Majority: 10,643 (28.41%) | Dame Jill Knight | Conservative | 23,690 | 63.24 | |||
| John Sever | Labour | 13,047 | 34.83 | |||||
| Daphne Howlett | Independent | 725 | 1.94 | |||||
| General Election 1966 Turnout: 67.82% | Conservative hold Majority: 7,534 (21.51%) | Dame Jill Knight | Conservative | 18,869 | 53.86 | |||
| EO Smith | Labour | 11,335 | 32.36 | |||||
| DJ Badger | Liberal | 4,829 | 13.78 | |||||
| General Election 1964 Turnout: 66.47% | Conservative hold Majority: 11,759 (34.71%) | Dame Edith Pitt | Conservative | 22,818 | 67.36 | |||
| AJ Kazantzis | Labour | 11,059 | 32,64 | |||||
| General Election 1959 Turnout: 67.97% | Conservative hold Majority: 14,928 (39.41%) | Dame Edith Pitt | Conservative | 26,401 | 69.71 | |||
| NF Hinks | Labour | 11,473 | 30.29 | |||||
| General Election 1955 Turnout: 68.22% | Conservative hold Majority: 14,094 (35.33%) | Dame Edith Pitt | Conservative | 26,991 | 67.67 | |||
| KV Russell | Labour | 12,897 | 32.33 | |||||
| By-election, 2 July 1953 | Conservative hold Majority: 10,507 | Dame Edith Pitt | Conservative | 20,142 | ||||
| FB Watson | Labour | 9,635 | ||||||
| General Election 1951 Turnout: 76.06% | Conservative hold Majority: 13,104 (28.58%) | Peter Bennett | Conservative | 29,477 | 64.29 | |||
| WJS Pringle | Labour | 16,373 | 35.71 | |||||
| General Election 1950 Turnout: 78.76% | Conservative hold Majority: 11,892 (25.35%) | Peter Bennett | Conservative | 29,404 | 62.67 | |||
| JA Hobson | Labour | 17,512 | 37.33 | |||||
| General Election 1945 Turnout: 69.18% | Conservative hold Majority: 8,618 (21.43%) | Peter Bennett | Conservative | 21,497 | 53.46 | |||
| GC Barrow | Labour | 12,879 | 32.03 | |||||
| Arthur Asher Shenfield | Liberal | 5,832 | 14.50 | |||||
| By-election, 9 December 1940 | Conservative hold | Peter Bennett | Conservative | unopposed | ||||
| General Election 1935 Turnout: 62.41% | Conservative hold Majority: 21,862 (63.14%) | Rt Hon Neville Chamberlain | Conservative | 28,243 | 81.57 | |||
| J Adshead | Labour | 6,381 | 18.43 | |||||
| General Election 1931 Turnout: 70.88% | Conservative hold Majority: 27,928 (73.03%) | Rt Hon Neville Chamberlain | Conservative | 33,085 | 86.51 | |||
| WW Blaylock | Labour | 5,157 | 13.49 | |||||
Election results 1918-1929
| Party | Candidate | Votes | % | ± | |
|---|---|---|---|---|---|
| Unionist | Rt Hon. Arthur Neville Chamberlain | 23,350 | 63.7 | ||
| Labour | William Henry Dashwood Caple | 8,590 | 23.4 | ||
| Liberal | Percy Reginald Coombs Young | 4,720 | 12.9 | n/a | |
| Majority | 14,760 | 40.3 | |||
| Turnout | |||||
| Unionist hold | Swing | ||||
| Party | Candidate | Votes | % | ± | |
|---|---|---|---|---|---|
| Unionist | Sir Francis William Lowe | 15,459 | 72.2 | ||
| Liberal | Alfred William Bowkett | 5,962 | 27.8 | n/a | |
| Majority | 9,497 | 44.4 | |||
| Turnout | 56.7 | ||||
| Unionist hold | Swing | ||||
Election results 1885-1910
See also
Notes and references
- Notes
- ↑ A borough constituency (for the purposes of election expenses and type of returning officer)
- ↑ As with all constituencies, the constituency elects one Member of Parliament (MP) by the first past the post system of election at least every five years.
- References
- ↑ "Birmingham, Edgbaston: Usual Resident Population, 2011". Neighbourhood Statistics. Office for National Statistics. Retrieved 29 January 2015.
- ↑ "Electorate Figures - Boundary Commission for England". 2011 Electorate Figures. Boundary Commission for England. 4 March 2011. Archived from the original on 6 November 2010. Retrieved 13 March 2011.
- ↑ "Order of Declaration in the 1997 Election". demon.co.uk.
- ↑ "House of Commons Hansard Debates for 10 Apr 2013 (pt 0002)". parliament.uk.
- ↑ "Voter Power Index results for Birmingham Edgbaston". voterpower.org.uk.
- ↑ Leigh Rayment's Historical List of MPs – Constituencies beginning with "E" (part 1)
- ↑ "Election Data 2015". Electoral Calculus. Archived from the original on 17 October 2015. Retrieved 17 October 2015.
- 1 2 "UK ELECTION RESULTS". electionresults.blogspot.co.uk.
- ↑ "Parliamentary Candidates". ukipbirmingham.org.
- ↑ "Election Data 2010". Electoral Calculus. Archived from the original on 17 October 2015. Retrieved 17 October 2015.
- ↑ "Election Data 2005". Electoral Calculus. Archived from the original on 15 October 2011. Retrieved 18 October 2015.
- ↑ "Election Data 2001". Electoral Calculus. Archived from the original on 15 October 2011. Retrieved 18 October 2015.
- ↑ "Election Data 1997". Electoral Calculus. Archived from the original on 15 October 2011. Retrieved 18 October 2015.
- ↑ "Election Data 1992". Electoral Calculus. Archived from the original on 15 October 2011. Retrieved 18 October 2015.
- ↑ "Election Data 1987". Electoral Calculus. Archived from the original on 15 October 2011. Retrieved 18 October 2015.
- ↑ "Election Data 1983". Electoral Calculus. Archived from the original on 15 October 2011. Retrieved 18 October 2015.
- 1 2 British Parliamentary Election Results 1918-1949, FWS Craig
- British Parliamentary Election Results 1885-1918, compiled and edited by F.W.S. Craig (Macmillan Press 1974)
- Debrett’s Illustrated Heraldic and Biographical House of Commons and the Judicial Bench 1886
- Debrett’s House of Commons and the Judicial Bench 1901
- Debrett’s House of Commons and the Judicial Bench 1918
External links
| Parliament of the United Kingdom | ||
|---|---|---|
| Preceded by Colne Valley |
Constituency represented by the Chancellor of the Exchequer 1931–1937 |
Succeeded by Spen Valley |
| Preceded by Bewdley |
Constituency represented by the Prime Minister 1937–1940 |
Succeeded by Epping |