Bromsgrove (UK Parliament constituency)
| Bromsgrove | |
|---|---|
|
County constituency for the House of Commons | |
|
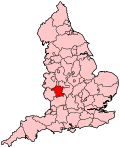
Boundary of Bromsgrove in Worcestershire. | |
|
Location of Worcestershire within England. | |
| County | Worcestershire |
| Population | 93,637 (2011 census)[1] |
| Electorate | 73,279 (December 2010)[2] |
| Major settlements | Bromsgrove |
| Current constituency | |
| Created | 1983 |
| Member of parliament | Sajid Javid (Conservative) |
| Number of members | One |
| Created from | Bromsgrove & Redditch |
| 1950–1974 | |
| Number of members | One |
| Type of constituency | County constituency |
| Replaced by | Bromsgrove & Redditch |
| Overlaps | |
| European Parliament constituency | West Midlands |

Bromsgrove is a constituency[n 1] represented in the House of Commons of the Parliament of the United Kingdom since 2010 by Sajid Javid of the Conservative Party.[n 2]
Boundaries
1950-1974: The Urban Districts of Bromsgrove and Redditch, and the Rural District of Bromsgrove.
1983–present: The District of Bromsgrove.
The constituency covers the same area as Bromsgrove District Council in north Worcestershire, with twenty civil parishes. It includes the villages of Alvechurch, Barnt Green, Belbroughton, Blackwell, Clent, Cofton Hackett, Hagley, Hollywood, Lickey, Marlbrook, Rubery, Tardebigge and Wythall.
History
The borough of Bromsgrove returned two members (Thomas Rassall and Thomas Barneford) to the original Model Parliament in 1295. However, borough status appeared lost when no other member was sent to any subsequent parliament under that status.[3]
Since its split from the neighbouring Redditch Constituency in 1983, it has returned a Conservative Member of Parliament (MP).
The MP from 1997 to 2010, Julie Kirkbride, announced on 28 May 2009 that she would be standing down as an MP at the next General Election in light of the expenses scandal.[4] Her resignation was confirmed in December 2009, after an attempt to withdraw it.[5] The winner of the 2010 election, Sajid Javid (formerly the youngest Vice President of Chase Manhattan Bank and a Deutsche Bank board director) has held roles in government as Economic Secretary to the Treasury, Secretary of State for Culture, Media and Sport, and since 2015, Secretary of State for Business, Innovation and Skills
Members of Parliament
MPs 1950–1974
| Election | Member[6][7] | Party | |
|---|---|---|---|
| 1950 | Michael Higgs | Conservative | |
| 1955 | James Dance | Conservative | |
| 1971 by-election | Terry Davis | Labour | |
| Feb 1974 | constituency abolished: see Bromsgrove & Redditch | ||
MPs since 1983
| Election | Member[6][7] | Party | |
|---|---|---|---|
| 1983 | Sir Hal Miller | Conservative | |
| 1992 | Roy Thomason | Conservative | |
| 1997 | Julie Kirkbride | Conservative | |
| 2010 | Sajid Javid | Conservative | |
Elections
Elections in the 2010s
| Party | Candidate | Votes | % | ± | |
|---|---|---|---|---|---|
| Conservative | Sajid Javid | 28,133 | 53.8 | +10.2 | |
| Labour | Tom Ebbutt | 11,604 | 22.2 | +0.4 | |
| UKIP | Stuart Cross | 8,163 | 15.6 | +9.9 | |
| Liberal Democrat | Bart Ricketts [9] | 2,616 | 5.0 | −14.6 | |
| Green | Giovanni Esposito [10] | 1,729 | 3.3 | +3.3 | |
| Majority | 16,529 | 31.6 | +9.7 | ||
| Turnout | 52,245 | 71.2 | +0.6 | ||
| Conservative hold | Swing | ||||
| Party | Candidate | Votes | % | ± | |
|---|---|---|---|---|---|
| Conservative | Sajid Javid | 22,558 | 43.7 | −7.3 | |
| Labour | Sam Burden | 11,250 | 21.8 | −8.1 | |
| Liberal Democrat | Philip Ling | 10,124 | 19.6 | +4.6 | |
| UKIP | Steven Morson | 2,950 | 5.7 | +1.7 | |
| Bromsgrove Independent Conservative | Adrian Kriss | 2,182 | 4.2 | N/A | |
| BNP | Elizabeth Wainwright | 1,923 | 3.7 | N/A | |
| Independent | Mark France | 336 | 0.7 | N/A | |
| Independent | Ken Wheatley | 307 | 0.6 | N/A | |
| Majority | 11,308 | 21.9 | |||
| Turnout | 51,630 | 70.6 | +3.1 | ||
| Conservative hold | Swing | +0.4 | |||
Elections in the 2000s
| Party | Candidate | Votes | % | ± | |
|---|---|---|---|---|---|
| Conservative | Julie Kirkbride | 24,387 | 51.0 | −0.7 | |
| Labour | David Jones | 14,307 | 29.9 | −4.0 | |
| Liberal Democrat | Sue Haswell | 7,197 | 15.1 | +3.2 | |
| UKIP | Paul Buckingham | 1,919 | 4.0 | +1.6 | |
| Majority | 10,080 | 21.1 | |||
| Turnout | 47,810 | 67.6 | +0.5 | ||
| Conservative hold | Swing | ||||
| Party | Candidate | Votes | % | ± | |
|---|---|---|---|---|---|
| Conservative | Julie Kirkbride | 23,640 | 51.7 | +4.6 | |
| Labour | Peter M. McDonald | 15,502 | 33.9 | −3.9 | |
| Liberal Democrat | Mrs. Margaret Rowley | 5,430 | 11.9 | N/A | |
| UKIP | Ian N. Gregory | 1,112 | 2.4 | +2.0 | |
| Majority | 8,138 | 17.8 | |||
| Turnout | 45,684 | 67.1 | −10.0 | ||
| Conservative hold | Swing | ||||
Elections in the 1990s
| Party | Candidate | Votes | % | ± | |
|---|---|---|---|---|---|
| Conservative | Julie Kirkbride | 23,640 | 47.2 | −6.9 | |
| Labour | Peter M. McDonald | 19,725 | 37.8 | +7.1 | |
| Liberal Democrat | Mrs. Jennette M. Davy | 6,200 | 11.9 | −1.9 | |
| Referendum | Mrs. Diana Winsor | 1,411 | 2.7 | N/A | |
| UKIP | Mrs. Beatrice G. Wetton | 251 | 0.5 | N/A | |
| Majority | 4,895 | 5.4 | −18.0 | ||
| Turnout | 52,207 | 77.1 | −5.4 | ||
| Conservative hold | Swing | −7.0 | |||
| Party | Candidate | Votes | % | ± | |
|---|---|---|---|---|---|
| Conservative | Roy Thomason | 31,709 | 54.1 | −0.7 | |
| Labour | Ms. Catherine M.V. Mole | 18,007 | 30.7 | +7.4 | |
| Liberal Democrat | Ms. Alexis J. Cassin | 8,090 | 13.8 | −8.2 | |
| Green | John C. Churchman | 856 | 1.5 | N/A | |
| Majority | 13,702 | 23.4 | −8.1 | ||
| Turnout | 58,662 | 82.5 | +6.1 | ||
| Conservative hold | Swing | −4.0 | |||
Elections in the 1980s
| Party | Candidate | Votes | % | ± | |
|---|---|---|---|---|---|
| Conservative | Hal Miller | 29,051 | 54.7 | −1.5 | |
| Labour | Joseph Downie Ward | 12,366 | 23.3 | +2.6 | |
| Social Democratic | David Leslie Cropp | 11,663 | 22.0 | +0.4 | |
| Majority | 16,685 | 31.4 | −3.2 | ||
| Turnout | 53,080 | 76.4 | +1.3 | ||
| Conservative hold | Swing | −2.1 | |||
| Party | Candidate | Votes | % | ± | |
|---|---|---|---|---|---|
| Conservative | Hal Miller | 27,911 | 56.2 | N/A | |
| Social Democratic | A.J. Milligan | 10,736 | 21.6 | N/A | |
| Labour | G. Titley | 10,280 | 20.7 | N/A | |
| Ecology | John C. Churchman | 716 | 1.5 | N/A | |
| Majority | 17,175 | 34.6 | N/A | ||
| Turnout | 49,643 | 75.1 | N/A | ||
| Conservative win (new seat) | |||||
Elections 1950-71
| Party | Candidate | Votes | % | ± | |
|---|---|---|---|---|---|
| Labour | Terry Davis | 29,809 | 51.62 | +10.09 | |
| Conservative | Hal Miller | 27,941 | 48.38 | -10.09 | |
| Majority | 1,868 | 3.24 | |||
| Turnout | 57,750 | ||||
| Labour gain from Conservative | Swing | ||||
| Party | Candidate | Votes | % | ± | |
|---|---|---|---|---|---|
| Conservative | James Dance | 37,544 | 58.47 | ||
| Labour | Terry Davis | 26,670 | 41.53 | ||
| Majority | 10,874 | 16.93 | |||
| Turnout | 64,214 | 76.51 | |||
| Conservative hold | Swing | ||||
| Party | Candidate | Votes | % | ± | |
|---|---|---|---|---|---|
| Conservative | James Dance | 32,400 | 53.02 | ||
| Labour | NP Lister | 28,704 | 46.98 | ||
| Majority | 3,696 | 6.05 | |||
| Turnout | 79.90 | ||||
| Conservative hold | Swing | ||||
| Party | Candidate | Votes | % | ± | |
|---|---|---|---|---|---|
| Conservative | James Dance | 29,616 | 48.73 | ||
| Labour | NP Lister | 22,673 | 37.31 | ||
| Liberal | SL Stockdale | 8,485 | 13.96 | ||
| Majority | 6,943 | 11.42 | |||
| Turnout | 82.94 | ||||
| Conservative hold | Swing | ||||
| Party | Candidate | Votes | % | ± | |
|---|---|---|---|---|---|
| Conservative | James Dance | 32,473 | 58.08 | ||
| Labour | CBB Norwood | 23,433 | 41.92 | ||
| Majority | 9,040 | 16.17 | |||
| Turnout | 83.54 | ||||
| Conservative hold | Swing | ||||
| Party | Candidate | Votes | % | ± | |
|---|---|---|---|---|---|
| Conservative | James Dance | 27,461 | 55.20 | ||
| Labour | LJ George | 22,287 | 44.80 | ||
| Majority | 5,174 | 10.40 | |||
| Turnout | 81.69 | ||||
| Conservative hold | Swing | ||||
| Party | Candidate | Votes | % | ± | |
|---|---|---|---|---|---|
| Conservative | Michael Higgs | 26,736 | 52.61 | ||
| Labour | D Chesworth | 24,083 | 47.39 | ||
| Majority | 2,653 | 5.22 | |||
| Turnout | 86.48 | ||||
| Conservative hold | Swing | ||||
| Party | Candidate | Votes | % | ± | |
|---|---|---|---|---|---|
| Conservative | Michael Higgs | 21,674 | 43.96 | ||
| Labour | DP Chesworth | 21,484 | 43.58 | ||
| Liberal | RWT Hill | 6,145 | 12.46 | ||
| Majority | 190 | 0.39 | |||
| Turnout | 85.80 | ||||
| Conservative hold | Swing | ||||
See also
Notes and references
- Notes
- ↑ A county constituency (for the purposes of election expenses and type of returning officer)
- ↑ As with all constituencies, the constituency elects one Member of Parliament (MP) by the first past the post system of election at least every five years.
- References
- ↑ "Bromsgrove: Usual Resident Population, 2011". Neighbourhood Statistics. Office for National Statistics. Retrieved 4 February 2015.
- ↑ "Electorate Figures - Boundary Commission for England". 2011 Electorate Figures. Boundary Commission for England. 4 March 2011. Archived from the original on 6 November 2010. Retrieved 13 March 2011.
- ↑ Treadway Russell Nash, History and Antiquities of the County of Worcester I (1781), introduction, xxxii.
- ↑ http://www.guardian.co.uk/politics/2009/may/28/julie-kirkbride-expenses-quitting
- ↑ Times online
- 1 2 "Bromsgrove 1950-". Hansard 1803-2005. UK Parliament. Retrieved 2 February 2015.
- 1 2 Leigh Rayment's Historical List of MPs – Constituencies beginning with "B" (part 6)
- ↑ "Election Data 2015". Electoral Calculus. Archived from the original on 17 October 2015. Retrieved 17 October 2015.
- ↑ "List of selected candidates". Liberal Democrats. 4 March 2015. Retrieved 15 March 2015.
- ↑ http://www.bromsgroveadvertiser.co.uk/news/11845604.Bromsgrove_Green_Party_select_their_parliamentary_candidate/?ref=mr
- ↑ "Election Data 2010". Electoral Calculus. Archived from the original on 17 October 2015. Retrieved 17 October 2015.
- ↑ "Election Data 2005". Electoral Calculus. Archived from the original on 15 October 2011. Retrieved 18 October 2015.
- ↑ "Election Data 2001". Electoral Calculus. Archived from the original on 15 October 2011. Retrieved 18 October 2015.
- ↑ "Election Data 1997". Electoral Calculus. Archived from the original on 15 October 2011. Retrieved 18 October 2015.
- ↑ "Politics Resources". Election 1997. Politics Resources. 17 November 2010. Retrieved 2012-11-04.
- ↑ "Election Data 1992". Electoral Calculus. Archived from the original on 15 October 2011. Retrieved 18 October 2015.
- ↑ "Politics Resources". Election 1992. Politics Resources. 9 April 1992. Retrieved 2010-12-06.
- ↑ "Election Data 1987". Electoral Calculus. Archived from the original on 15 October 2011. Retrieved 18 October 2015.
- ↑ "Election Data 1983". Electoral Calculus. Archived from the original on 15 October 2011. Retrieved 18 October 2015.
External links
- nomis Constituency Profile for Bromsgrove — presenting data from the ONS annual population survey and other official statistics.
Coordinates: 52°24′N 2°06′W / 52.4°N 2.1°W