Thermodynamic databases for pure substances
| Thermodynamics | ||||||||||||
|---|---|---|---|---|---|---|---|---|---|---|---|---|
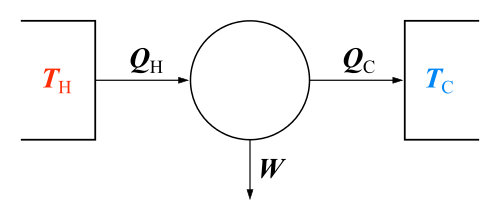 The classical Carnot heat engine | ||||||||||||
|
Branches |
||||||||||||
|
||||||||||||
| Book:Thermodynamics | ||||||||||||


Thermodynamic databases contain information about thermodynamic properties for substances, the most important being enthalpy, entropy, and Gibbs free energy. Numerical values of these thermodynamic properties are collected as tables or are calculated from thermodynamic datafiles. Data is expressed as temperature-dependent values for one mole of substance at the standard pressure of 101.325 kPa (1 atm), or 100 kPa (1 bar). Unfortunately, both of these definitions for the standard condition for pressure are in use.
Thermodynamic data
Thermodynamic data is usually presented as a table or chart of function values for one mole of a substance (or in the case of the steam tables, one kg). A thermodynamic datafile is a set of equation parameters from which the numerical data values can be calculated. Tables and datafiles are usually presented at a standard pressure of 1 bar or 1 atm, but in the case of steam and other industrially important gases, pressure may be included as a variable. Function values depend on the state of aggregation of the substance, which must be defined for the value to have any meaning. The state of aggregation for thermodynamic purposes is the standard state, sometimes called the reference state, and defined by specifying certain conditions. The normal standard state is commonly defined as the most stable physical form of the substance at the specified temperature and a pressure of 1 bar or 1 atm. However, since any non-normal condition could be chosen as a standard state, it must be defined in the context of use. A physical standard state is one that exists for a time sufficient to allow measurements of its properties. The most common physical standard state is one that is stable thermodynamically (i.e., the normal one). It has no tendency to transform into any other physical state. If a substance can exist but is not thermodynamically stable (for example, a supercooled liquid), it is called a metastable state. A non-physical standard state is one whose properties are obtained by extrapolation from a physical state (for example, a solid superheated above the normal melting point, or an ideal gas at a condition where the real gas is non-ideal). Metastable liquids and solids are important because some substances can persist and be used in that state indefinitely. Thermodynamic functions that refer to conditions in the normal standard state are designated with a small superscript °. The relationship between certain physical and thermodynamic properties may be described by an equation of state.
Enthalpy, heat content and heat capacity
It is very difficult to measure the absolute amount of any thermodynamic quantity involving the internal energy (e.g. enthalpy), since the internal energy of a substance can take many forms, each of which has its own typical temperature at which it begins to become important in thermodynamic reactions. It is therefore the change in these functions that is of most interest. The isobaric change in enthalpy H above the common reference temperature of 298.15 K (25 °C) is called the high temperature heat content, the sensible heat, or the relative high-temperature enthalpy, and called henceforth the heat content. Different databases designate this term in different ways; for example HT-H298, H°-H°298, H°T-H°298 or H°-H°(Tr), where Tr means the reference temperature (usually 298.15 K, but abbreviated in heat content symbols as 298). All of these terms mean the molar heat content for a substance in its normal standard state above a reference temperature of 298.15 K. Data for gases is for the hypothetical ideal gas at the designated standard pressure. The SI unit for enthalpy is J/mol, and is a positive number above the reference temperature. The heat content has been measured and tabulated for virtually all known substances, and is commonly expressed as a polynomial function of temperature. The heat content of an ideal gas is independent of pressure (or volume), but the heat content of real gases varies with pressure, hence the need to define the state for the gas (real or ideal) and the pressure. Note that for some thermodynamic databases such as for steam, the reference temperature is 273.15 K (0 °C).
The heat capacity C is the ratio of heat added to the temperature increase. For an incremental isobaric addition of heat:

Cp is therefore the slope of a plot of temperature vs. isobaric heat content (or the derivative of a temperature/heat content equation). The SI units for heat capacity are J/(mol·K).


Enthalpy change of phase transitions
When heat is added to a condensed-phase substance, its temperature increases until a phase change temperature is reached. With further addition of heat, the temperature remains constant while the phase transition takes place. The amount of substance that transforms is a function of the amount of heat added. After the transition is complete, adding more heat increases the temperature. In other words, the enthalpy of a substance changes isothermally as it undergoes a physical change. The enthalpy change resulting from a phase transition is designated ΔH. There are four types of enthalpy changes resulting from a phase transition. To wit:
- Enthalpy of transformation. This applies to the transformations from one solid phase to another, such as the transformation from α-Fe (bcc ferrite) to -Fe (fcc austenite). The transformation is designated ΔHtr.
- Enthalpy of fusion or melting. This applies to the transition of a solid to a liquid and is designated ΔHm.
- Enthalpy of vaporization. This applies to the transition of a liquid to a vapor and is designated ΔHv.
- Enthalpy of sublimation. This applies to the transition of a solid to a vapor and is designated ΔHs.

Cp is infinite at phase transition temperatures because the enthalpy changes isothermally. At the Curie temperature, Cp shows a sharp discontinuity while the enthalpy has a change in slope.
Values of ΔH are usually given for the transition at the normal standard state temperature for the two states, and if so, are designated with a superscript °. ΔH for a phase transition is a weak function of temperature. In some texts, the heats of phase transitions are called latent heats (for example, latent heat of fusion).
.PNG)
Enthalpy change for a chemical reaction
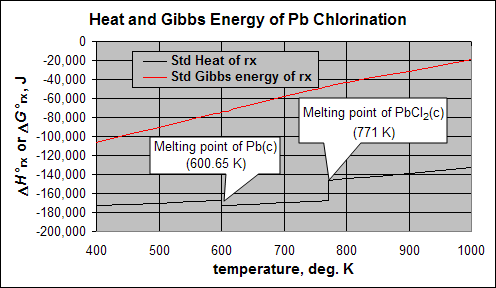
An enthalpy change occurs during a chemical reaction. For the special case of the formation of a compound from the elements, the change is designated ΔHform and is a weak function of temperature. Values of ΔHform are usually given where the elements and compound are in their normal standard states, and as such are designated standard heats of formation, as designated by a superscript °. The ΔH°form undergoes discontinuities at a phase transition temperatures of the constituent element(s) and the compound. The enthalpy change for any standard reaction is designated ΔH°rx.
.PNG)
Entropy and Gibbs energy
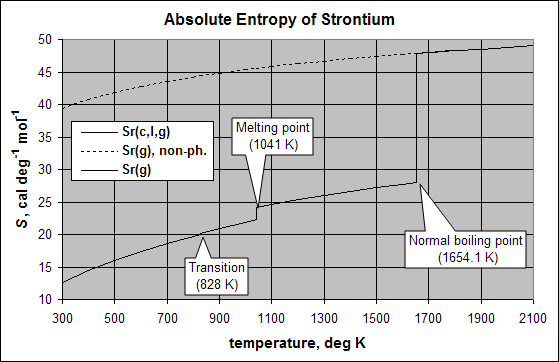
The entropy of a system is another thermodynamic quantity that is not easily measured. However, using a combination of theoretical and experimental techniques, entropy can in fact be accurately estimated. At low temperatures, the Debye model leads to the result that the atomic heat capacity Cv for solids should be proportional to T3, and that for perfect crystalline solids it should become zero at absolute zero. Experimentally, the heat capacity is measured at temperature intervals to as low a temperature as possible. Values of Cp/T are plotted against T for the whole range of temperatures where the substance exists in the same physical state. The data are extrapolated from the lowest experimental temperature to 0 K using the Debye model. The third law of thermodynamics states that the entropy of a perfect crystalline substance becomes zero at 0 K. When S0 is zero, the area under the curve from 0 K to any temperature gives the entropy at that temperature. Even though the Debye model contains Cv instead of Cp, the difference between the two at temperatures near 0 K is so small as to be negligible.
The absolute value of entropy for a substance in its standard state at the reference temperature of 298.15 K is designated S°298. Entropy increases with temperature, and is discontinuous at phase transition temperatures. The change in entropy (ΔS°) at the normal phase transition temperature is equal to the heat of transition divided by the transition temperature. The SI units for entropy are J/(mol·K).
The standard entropy change for the formation of a compound from the elements, or for any standard reaction is designated ΔS°form or ΔS°rx. The entropy change is obtained by summing the absolute entropies of the products minus the sum of the absolute entropies of the reactants. Like enthalpy, the Gibbs energy G has no intrinsic value, so it is the change in G that is of interest. Furthermore, there is no change in G at phase transitions between substances in their standard states. Hence, the main functional application of Gibbs energy from a thermodynamic database is its change in value during the formation of a compound from the standard-state elements, or for any standard chemical reaction (ΔG°form or ΔG°rx). The SI units of Gibbs energy are the same as for enthalpy (J/mol).
Additional functions
Compilers of thermochemical databases may contain some additional thermodynamic functions. For example, the absolute enthalpy of a substance H(T) is defined in terms of its formation enthalpy and its heat content as follows:
![H(T) = \Delta H^\circ_{form,298} + [H_T - H_{298}]](../I/m/11baf8ae69ee017f55c991fc6544a8e396f5c8a9.svg)
For an element, H(T) and [HT - H298] are identical at all temperatures because ΔH°form is zero, and of course at 298.15 K, H(T) = 0. For a compound:

Similarly, the absolute Gibbs energy G(T) is defined by the absolute enthalpy and entropy of a substance:

For a compound:

Some tables may also contain the Gibbs energy function (H°298.15 – G°T)/T which is defined in terms of the entropy and heat content.

The Gibbs energy function has the same units as entropy, but unlike entropy, exhibits no discontinuity at normal phase transition temperatures.
The log10 of the equilibrium constant Keq is often listed, which is calculated from the defining thermodynamic equation.

Thermodynamic databases
A thermodynamic database consists of sets of critically evaluated values for the major thermodynamic functions. Originally, data was presented as printed tables at 1 atm and at certain temperatures, usually 100° intervals and at phase transition temperatures. Some compilations included polynomial equations that could be used to reproduce the tabular values. More recently, computerized databases are used which consist of the equation parameters and subroutines to calculate specific values at any temperature and prepare tables for printing. Computerized databases often include subroutines for calculating reaction properties and displaying the data as charts.
Thermodynamic data comes from many types of experiments, such as calorimetry, phase equilibria, spectroscopy, composition measurements of chemical equilibrium mixtures, and emf measurements of reversible reactions. A proper database takes all available information about the elements and compounds in the database, and assures that the presented results are internally consistent. Internal consistency requires that all values of the thermodynamic functions are correctly calculated by application of the appropriate thermodynamic equations. For example, values of the Gibbs energy obtained from high-temperature equilibrium emf methods must be identical to those calculated from calorimetric measurements of the enthalpy and entropy values. The database provider must use recognized data analysis procedures to resolve differences between data obtained by different types of experiments.
All thermodynamic data is a non-linear function of temperature (and pressure), but there is no universal equation format for expressing the various functions. Here we describe a commonly used polynomial equation to express the temperature dependence of the heat content. A common six-term equation for the isobaric heat content is:

Regardless of the equation format, the heat of formation of a compound at any temperature is ΔH°form at 298.15 K, plus the sum of the heat content parameters of the products minus the sum of the heat content parameters of the reactants. The Cp equation is obtained by taking the derivative of the heat content equation.

The entropy equation is obtained by integrating the Cp/T equation:

F' is a constant of integration obtained by inserting S° at any temperature T. The Gibbs energy of formation of a compound is obtained from the defining equation ΔG°form = ΔH°form – T(ΔS°form), and is expressed as


For most substances, ΔG°form deviates only slightly from linearity with temperature, so over a short temperature span, the seven-term equation can be replaced by a three-term equation, whose parameter values are obtained by regression of tabular values.

Depending on the accuracy of the data and the length of the temperature span, the heat content equation may require more or fewer terms. Over a very long temperature span, two equations may be used instead of one. It is unwise to extrapolate the equations to obtain values outside the range of experimental data used to derive the equation parameters.
Thermodynamic datafiles
The equation parameters and all other information required to calculate values of the important thermodynamic functions are stored in a thermodynamic datafile. The values are organized in a format that makes them readable by a thermodynamic calculation program or for use in a spreadsheet. For example, the Excel-based thermodynamic database FREED creates the following type of datafile, here for a standard pressure of 1 atm.
.PNG)
- Row 1. Molar mass of species, density at 298.15 K, ΔH°form 298.15, S°298.15. and the upper temperature limit for the file.
- Row 2. Number of Cp equations required. Here, three because of three species phases.
- Row 3. Values of the five parameters for the first Cp equation; temperature limit for the equation.
- Row 4. Values of the five parameters for the second Cp equation; temperature limit for the equation.
- Row 5. Values of the five parameters for the third Cp equation; temperature limit for the equation.
- Row 6. Number of HT - H298 equations required.
- Row 7. Values of the six parameters for the first HT - H298 equation; temperature limit for the equation, and ΔH°trans for the first phase change.
- Row 8. Values of the six parameters for the second HT - H298 equation; temperature limit for the equation, and ΔH°trans for the second phase change.
- Row 9. Values of the six parameters for the third HT - H298 equation; temperature limit for the equation, and ΔH°trans for the third phase change.
- Row 10. Number of ΔH°form equations required. Here five; three for species phases and two because one of the elements has a phase change.
- Row 11. Values of the six parameters for the first ΔH°form equation; temperature limit for the equation.
- Row 12. Values of the six parameters for the second ΔH°form equation; temperature limit for the equation.
- Row 13. Values of the six parameters for the third ΔH°form equation; temperature limit for the equation.
- Row 14. Values of the six parameters for the fourth ΔH°form equation; temperature limit for the equation.
- Row 15. Values of the six parameters for the fifth ΔH°form equation; temperature limit for the equation.
- Row 16. Number of ΔG°form equations required.
- Row 17. Values of the seven parameters for the first ΔG°form equation; temperature limit for the equation.
- Row 18. Values of the seven parameters for the second ΔG°form equation; temperature limit for the equation.
- Row 19. Values of the seven parameters for the third ΔG°form equation; temperature limit for the equation.
- Row 20. Values of the seven parameters for the fourth ΔG°form equation; temperature limit for the equation.
- Row 21. Values of the seven parameters for the fifth ΔG°form equation; temperature limit for the equation.
Most computerized databases will create a table of thermodynamic values using the values from the datafile. For MgCl2(c,l,g) at 1 atm pressure:
.PNG)
The table format is a common way to display thermodynamic data. The FREED table gives additional information in the top rows, such as the mass and amount composition and transition temperatures of the constituent elements. Transition temperatures for the constituent elements have dashes ------- in the first column in a blank row, such as at 922 K, the melting point of Mg. Transition temperatures for the substance have two blank rows with dashes, and a center row with the defined transition and the enthalpy change, such as the melting point of MgCl2 at 980 K. The datafile equations are at the bottom of the table, and the entire table is in an Excel worksheet. This is particularly useful when the data is intended for making specific calculations.
See also
- Chemical thermodynamics
- Physical chemistry
- Materials science
- Laws of thermodynamics
- Thermochemistry
- Standard temperature and pressure
- Dortmund Data Bank
- CALPHAD (method)
References
- Barin, Ihsan (2004). Thermochemical Data of Pure Substances. Wiley-VCH. ISBN 3-527-30993-4.
- Chase, M. W. (1998). NIST - JANAF Thermochemical Tables (Fourth ed.). Journal of Physical and Chemical Reference Data. ISBN 1-56396-831-2.
- Cox, J. D.; Wagman, Donald D.; Medvedev, Vadim A. (1989). CODATA Key Values for Thermodynamics. John Benjamins Publishing Co. ISBN 0-89116-758-7.
- Hummel, Wolfgang; Urs Berner; Enzo Curti; F. J. Pearson; Tres Thoenen (2002). Nagra/Psi Chemical Thermodynamic Data Base. Universal Publishers. ISBN 1-58112-620-4.
- Lide, David R.; Henry V. Kehiaian (1994). CRC Handbook of Thermophysical and Thermochemical Data (book & disk ed.). Boca Raton: CRC Press. ISBN 0-8493-0197-1.
- Pankratz, L. B. (1982). "Thermodynamic Properties of Elements and Oxides". U. S. Bureau of Mines Bulletin. 672.
- Pankratz, L. B. (1984). "Thermodynamic Properties of Halides". U. S. Bureau of Mines Bulletin. 674.
- Pankratz, L. B.; A. D. Mah; S. W. Watson (1987). "Thermodynamic Properties of Sulfides". U. S. Bureau of Mines Bulletin. 689.
- Pankratz, L. B. (1994). "Thermodynamic Properties of Carbides, Nitrides, and Other Selected Substances". U. S. Bureau of Mines Bulletin. 696.
- Robie, Richard A., and Bruce S. Hemingway (1995). Thermodynamic Properties of Minerals . . . at Higher Temperatures, U. S. Geological Survey Bulletin 2131.
- Yaws, Carl L. (2007). Yaws Handbook of Thermodynamic Properties for Hydrocarbons & Chemicals, Gulf Publishing Company. ISBN 1-933762-07-1.
- Gurvich, L.V., Veitz, I.V., et al. (1989) Thermodynamic Properties of Individual Substances. Fourth edition, Hemisphere Pub Co. NY, L., Vol.1 in 2 parts.
External links
- NIST WebBook A gateway to the data collection of the National Institute of Standards and Technology.
- NASA Glenn ThermoBuild A web interface to generate tabulated thermodynamic data.
- Burcat's Thermodynamic Database Database for more than 3,000 chemical species.
- DIPPR The Design Institute for Physical Properties
- DIPPR 801 Critically evaluated thermophysical property database useful for chemical process design and equilibrium calculations.
- MTDATA software and databases for calculation of thermodynamic properties and phase equilibria
- Free Steam Tables Online calculator based on IAPWS-IF97
- FACT-Web programs Various on-line tools for obtaining thermodynamic data and making equilibrium calculations.
- Mol-Instincts A chemical database based on Quantum Mechanics and QSPR, providing thermodynamic properties for millions of compounds.